EUR/USD 15M

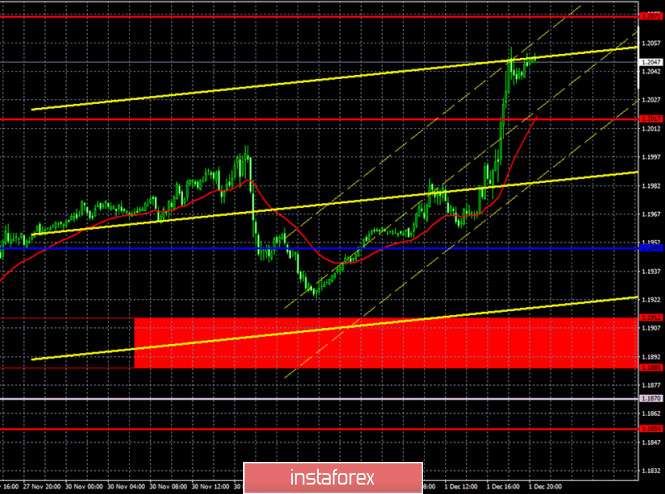
The linear regression channels turned to the upside again on the 15-minute timeframe, which is not surprising, since the upward movement resumed despite all technical and fundamental factors. Therefore, traders currently need to reach and overcome the 1.2071 level in order to expect the growth movement to continue.
EUR/USD 1H

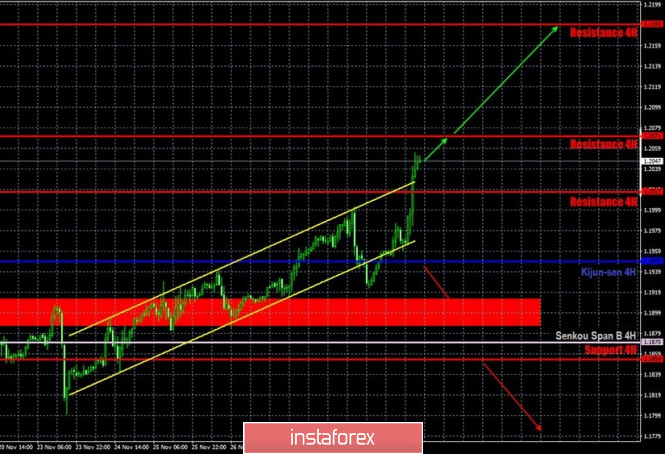
The EUR/USD pair did not start a new round of downward movement on the hourly timeframe on Tuesday, December 1. On the contrary, it reached the resistance level of 1.2017, updating the previous day's high, and then overcame it. Getting the pair to settle below the rising channel a day earlier did not play any role at all. And we once again ask ourselves the question, why is the euro significantly rising? Both the British pound and the euro are facing upward movement, and most technical signals are simply ignored. For the pound, the price has settled below the trend lines or channels several times over the past weeks, and each time the upward movement was brought back. It seems that now the same thing happened with the euro. It is very difficult to trade in the current environment, since technical signals are simply ignored by the market. Therefore, we recommend trading with the utmost caution or not trading at all. Bears are still out of work. They do not have enough strength to take the pair down by more than 100 points.
COT report

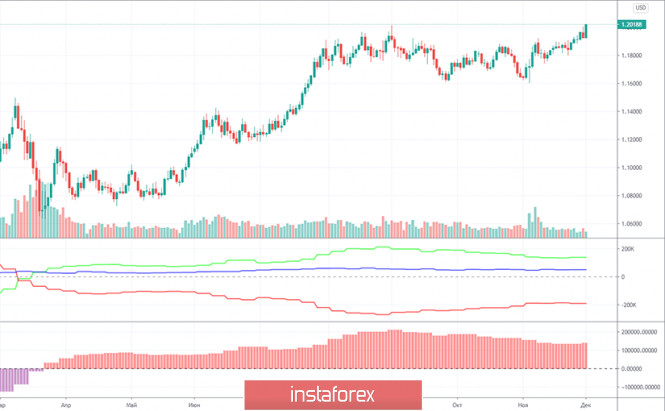
The EUR/USD pair fell by 10 points in the last reporting week (November 17-23). That is, the price changes were again minimal. This indicates a low activity from traders, primarily large traders, whose deals are displayed in the Commitment of Traders (COT) reports. What did the new report show us? Very little. As in the previous week, professional traders opened a small number of new contracts during the week, only about 3,700. Considering that the total number of contracts for the "non-commercial" group is more than 300,000, this means that 3,700 is only about 1%.
However, this time, despite the absence of price changes, professional traders became more bullish. Moreover, for 5,000 contracts at once. This is how the net position changed for the group of non-commercial traders, because in addition to the 3,000 Buy-contracts (longs) that are open, there were also 2,000 Sell-contracts (shorts) that were closed. So, quite unexpectedly, non-commercial traders began to increase their purchases of the euro after at least two months of their reduction. Don't jump to conclusions. So far, it's only been a week. Although, as we can see, according to the subsequent trades, the euro has significantly grown in price. The green and red lines began to diverge again on the first indicator. The second indicator started to show growth. Therefore, based on the latest COT report, we can conclude that the upward trend is resuming. However, we still advise you to be prepared for a possible new downward reversal.
The European Union published an index of business activity in the manufacturing sector. This figure rose from 53.6 to 53.8, showing that everything is in order in this industry, in contrast to the service sector. But eurozone inflation turned out to be bad. The main consumer price index fell further in November and now stands at -0.3% y/y. Therefore, the entire fundamental background was not in favor of the euro when it gained another 100 points. At that time, the speeches of Jerome Powell and Christine Lagarde had not yet taken place. As it turned out later, ECB President Lagarde did not inform the markets of anything that was particularly important, and the text of Fed Chairman Powell's speech was known a day before the speech itself and did not come as a surprise to traders. And so we can only conclude that the euro's growth was completely unfounded on Tuesday.
The European Union is set to publish the unemployment rate on Wednesday, which has rarely provoked a reaction from traders lately. A more important report will be published in America - the ADP report on changes in employment in the private sector, which is considered the second most important indicator of the state of the labor market after NonFarm Payrolls. It is expected that the increase will reach 420,000, but at this time, the entire macroeconomic background is ignored. Thus, traders may witness another day when the pair will show absolutely illogical movements.
We have two trading ideas for December 2:
1) Buyers continue to move up. Therefore, you are advised to continue trading upward with targets at the resistance levels of 1.2071 and 1.2180. However, there are few guidelines for maintaining the upward trend. The pair managed to get out of the ascending channel, so you can only start from the position of the Kijun-sen line (1.1949). But the price will not correct exactly to this line every time. Take Profit in this case can range from 20 to 120 points.
2) Bears are releasing the pair from their hands more and more every day, nevertheless, the current fundamental background allows them to count on a downward reversal in the near future. Thus, it is recommended to open sell orders with the first target at 1.1886 in case the price settles below the Kijun-sen line (1.1949). Take Profit in this case can be up to 50 points.
Forecast and trading signals for GBP/USD
Explanations for illustrations:
Support and Resistance Levels are the levels that serve as targets when buying or selling the pair. You can place Take Profit near these levels.
Kijun-sen and Senkou Span B lines are lines of the Ichimoku indicator transferred to the hourly timeframe from the 4-hour one.
Support and resistance areas are areas from which the price has repeatedly rebounded off.
Yellow lines are trend lines, trend channels and any other technical patterns.
Indicator 1 on the COT charts is the size of the net position of each category of traders.
Indicator 2 on the COT charts is the size of the net position for the "non-commercial" group.
The material has been provided by InstaForex Company - www.instaforex.com