To open long traders, we need the following conditions:
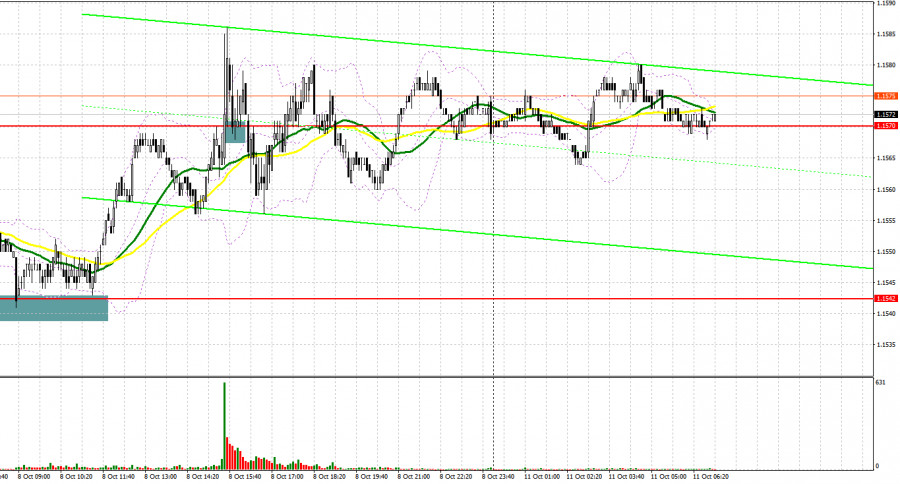
The US dollar remained unaffected by the controversial results of the Nonfarm Payrolls report. The jobs data turned out to be worse than expected. The euro slightly rose amid NFP data in the first half of the day. Let's look at the 5M chart and find out which entry points have been formed. In my morning forecast, I drew attention to the 1.1542 level and recommended making trading decisions depending on this level. There was a single to open long position after the pair made an unsuccessful attempt to break and fix below 1.1542. The euro/dollar pair recovered to the level of 1.1570 even before the publication of NFP data. Following the report, it broke through 1.1570 and then tested this level from top to bottom. It formed another entry to open long positions. Yet, the euro was unable to rise significantly and the pair was trading the entire New York session around the 1.1570 level.

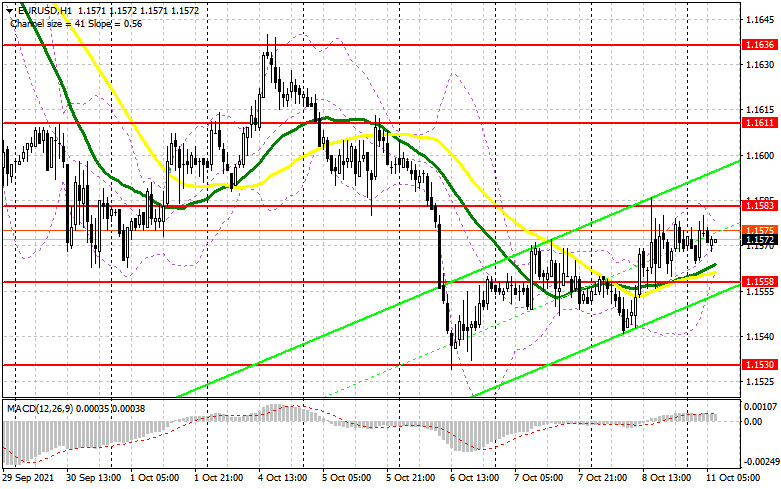
The euro has failed to approach new highs after weak US jobs data, indicating that traders refrain to buy the euro even at current levels. Today, trading is likely to unfold calmly with low volatility. Investors are sure to follow the results of Italy's industrial production data. They are also anticipating the speech of Philip Lane, a member of the ECB executive council, who may raise the topic of inflation in the eurozone. If so, it may foster the growth of the euro. Bulls are poised to keep the upward correction going. To do so, the pair needs to break through and consolidate above the 1.1583 level. Only the test from top to bottom forms a signal to open long trades on the euro with a possible rise to 1.1611. A more distant target will be the 1.1636 level. At this level, it is recommended to lock in profits. If the euro/dollar pair drops due to weak data on Italy's Industrial Production, it is better to refrain from opening long positions. The best scenario will be the formation of a false breakdown of the support area of 1.1558. Below this level, the moving averages pass, as well as the lower boundary of the ascending correctional channel. If the pair does not make attempts to reach this level, it is recommended to postpone opening long positions near the low of last week - 1.1530. It is better to open long positions immediately after a rebound from the support area of 1.1510 and 1.1482 and then, counting on an upward correction of 15-20 pips within a day.

To open short traders, we need the following conditions:
Market volatility is likely to be quite low as trading floors are closed in the US on the occasion of Columbus Day in the afternoon. However, bears are trying to take the upper hand. They want to push the pair to 1.1558. A breakthrough and a test of this level will lead to the formation of a signal to open short positions. If so, the EUR/USD pair may fall to the low of last week in the area of 1.1530. A more distant target will be the support level of 1.1510. At this level, it is recommended to lock in profits. Bears need to protect the resistance level of 1.1583 where trading is currently conducted. Only the formation of a false breakdown near the indicted level may push the pair to the support level of 1.1558. Below this level the moving averages indicating bullish momentum pass. If bears fail to send the pair down to the level of 1.1583, it is better to refrain from opening short positions until the test of a larger resistance level of 1.1611. One may open short positions immediately after a rebound counting on a downward correction of 15-20 pips from the high of 1.1636.

COT Report:
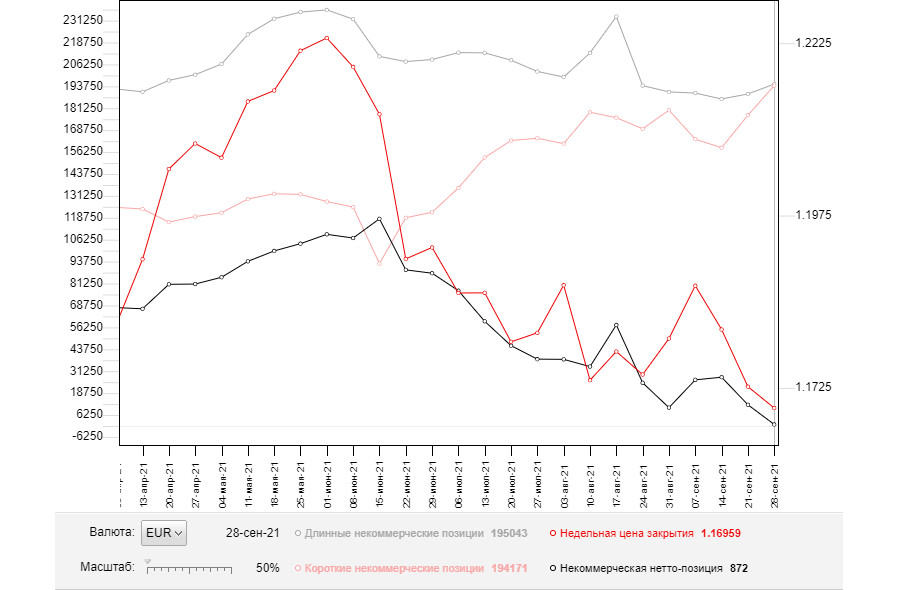
The COT report (Commitment of Traders) for September 28 showed a sharp increase in both short and long positions. However, the number of long positions was bigger, which led to a reduction in the net positions. Demand for the US dollar was high amid political woes in the country. At the same time, risker assets lost luster with investors. Traders opened long positions on the US dollar in anticipation of possible changes in the Fed's monetary policy as early as November of this year. Many investors expect the central bank to taper bond purchases at the end of the year. They are also digesting the results of the Nonfarm Payrolls report. Demand for risky assets will remain subdued due to the high probability of another wave of coronavirus spread, and its new Delta strain. Last week, the President of the European Central Bank said that she would continue to adhere to a wait-and-see approach and maintain the current parameters of the monetary. However, a surge in inflation in the 4th quarter of this year may change the regulator's plans. The COT report indicates that long non-commercial positions increased to 195,043 from 189,406, while short non-commercial positions jumped to 194,171 from 177,311. At the end of the week, the total number of non-commercial net positions dropped to 872 from 12,095. The weekly closing price also declined to 1.1695 from 1.1726.
Indicator signals:
Moving Averages
Trading is conducted above the 30 and 50 day moving averages, implying bulls' attempt to maintain the correctional movement.
Note: The timeframes and periods of moving averages viewed by the author on the H1 chart differ from the general definition of the classic daily moving averages on the daily chart.
Bollinger Bands
Volatility is very low, which does not give signals to enter the market.
Description of indicators
- Moving average (moving averages filter out the noise and make it easier to identify trends). Period 50. It is marked in yellow on the chart.
- Moving average (moving averages filter out the noise and make it easier to identify trends). Period 30. It is marked in green on the chart.
- MACD indicator (Moving Average Convergence/Divergence - convergence/divergence of moving averages) Fast EMA period 12. Slow EMA period 26. SMA period 9
- Bollinger Bands. Period 20
- Non-commercial traders, such as individual traders, hedge funds, and large institutions use the futures market for speculative trading and meet certain requirements.
- Long non-commercial positions represent the total number of long open positions of non-commercial traders.
- Short non-commercial positions represent the total number of short open positions of non-commercial traders.
- The total number of non-commercial net positions is the difference between the short and long positions of non-commercial traders.
