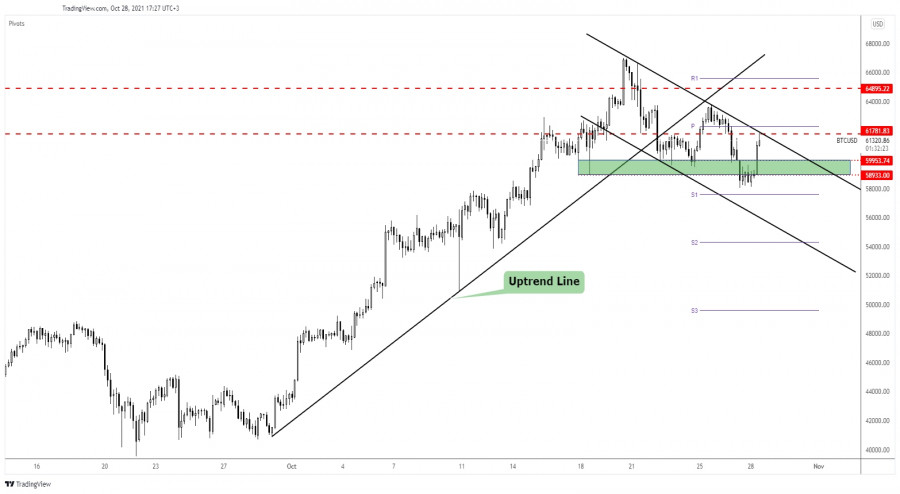
Bitcoin rallied after dropping as much as the 58,100.01 level. The crypto has found support around this level and now it has returned higher. It's traded at 61,419 level at the time of writing and is fighting hard to take out strong resistance levels.
BTC/USD is into a resistance area. It remains to see how the rate will react. A valid breakout could confirm further growth, while a rejection could signal a new leg down. It has registered a 6.45% growth from 58,100.01 yesterday's low to 61,848.54 today's high.
Despite today's growth, the BTC/USD price is still down by 3.69% in the last 7 days. Now, being in a resistance area, well have to wait for a fresh opportunity before taking action again.
BTC/USD Down Channel!

As you can see, the price of Bitcoin failed to stabilize under the 58,933 static support and now it has reached the 61,781.83 resistance and the downtrend line. Failing to reach the down channel's support signaled that the rate could come back higher.
Technically, we also have a confluence area at the intersection between 61,781.83 and the downtrend line. Making a valid breakout through this confluence area, above these obstacles, could signal further growth and could confirm the channel as a continuation pattern.
Bitcoin Prediction!
A valid breakout through the confluence area and above the weekly pivot of 62,310.02 could signal that the downside movement, the corrective phase is over. Registering a valid upside breakout from this pattern could activate an upside continuation.
On the other hand, registering only false breakouts, a bearish pattern in this resistance area could announce a new leg down.
The material has been provided by InstaForex Company - www.instaforex.com