Wave pattern
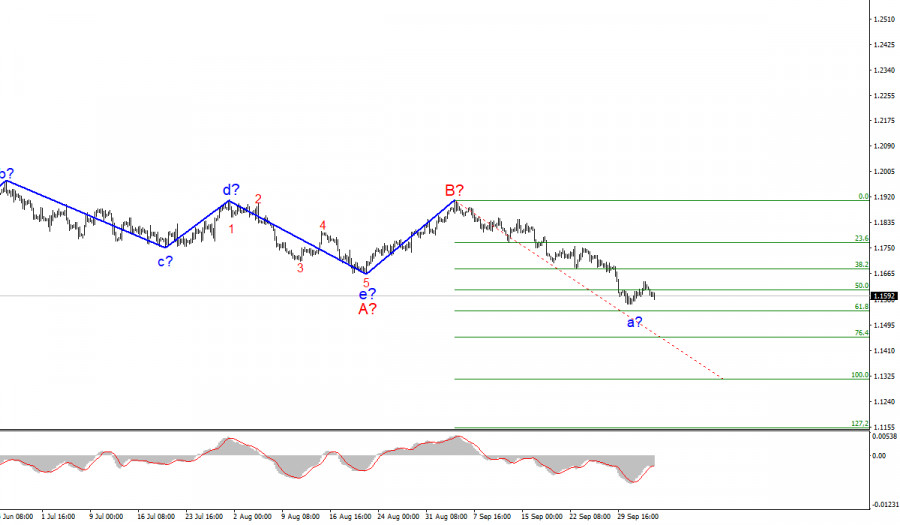
On the 4-hour chart, the wave layout for the euro/dollar pair has undergone certain changes. After the quotes dropped below the low of the previous wave, it became clear that the descending section of the trend resumed its formation. Consequently, it was necessary to make such adjustments that would involve the segment of the a-b-c-d-e trend which has been forming since the very beginning of the year. I believe that this section can be regarded as wave A and the next ascending section as wave B. If this is true, then the construction of the supposed wave C has already started. It can take a very extended form given the size of the wave A. At the same time, the entire trend section may take a correctional form of an A-B-C three-wave pattern. Thus, the instrument is very likely to decline further since only one wave is visible inside wave C so far, while there should be three waves at least. At this time, I expect to see the formation of wave b inside wave C.
Strong ISM Services PMI
Tuesday was not full of events for the euro. Still, the European Union released PMI in the services sector which turned out to be slightly better than expected. On the other hand, the PPI came in below market expectations. Meanwhile, the demand for the US dollar was steadily rising, thus leading to a drop in the pair quotes. A further construction of the supposed corrective wave b is now under question, and wave a may take on a more extended form. Nevertheless, today there is still one important event that can have an impact on the market. Around this time, ECB President Christine Lagarde will deliver a speech which is always in the focus of traders. I think that the market reaction will hardly be strong this time because Christine Lagarde simply has nothing new to say. There have been no important economic reports lately and no dramatic changes in the economy. Therefore, the ECB President is unlikely to surprise the markets today. Thus, I expect that EUR/USD will continue its slow decline throughout the session. Also, I would like to note that a couple of hours ago a strong ISM report was released in the US which could support the US dollar's rise.
Conclusion
Based on the given analysis, I can conclude that the construction of the descending wave C will continue for some time. Therefore, I would recommend selling the pair following each sell signal from the MACD indicator with the targets located near the levels of 1.1608 and 1.1540. They correspond to 50.0% and 61.8% Fibonacci levels respectively. However, we need to wait until the assumed wave b completes its formation inside wave C. After that, the quotes will continue to decline.

Larger time frame
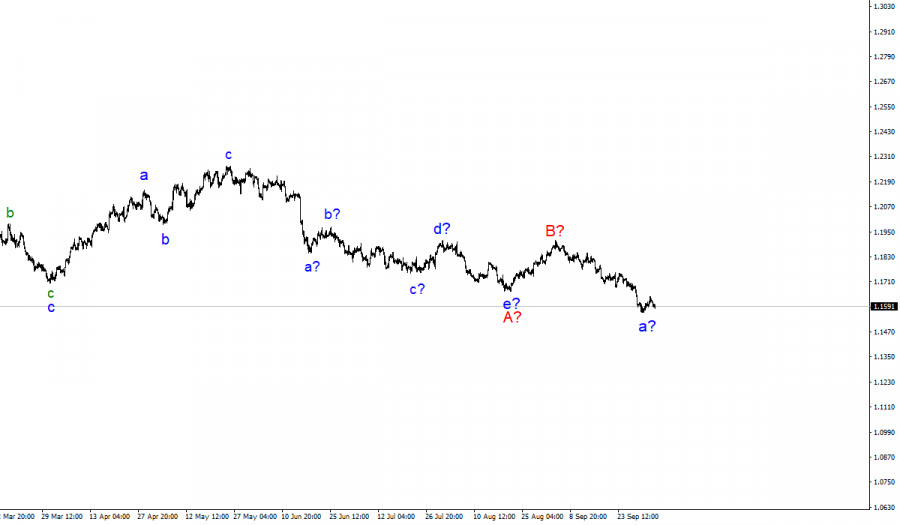
A wave layout on a larger time frame looks quite convincing. The quotes continue to fall, and the descending part of the trend, which was initiated on May 25, takes the form of a correctional structure of an A-B-C three-wave pattern. Thus, the decline may continue for several more months until wave C is fully completed.
The material has been provided by InstaForex Company - www.instaforex.com