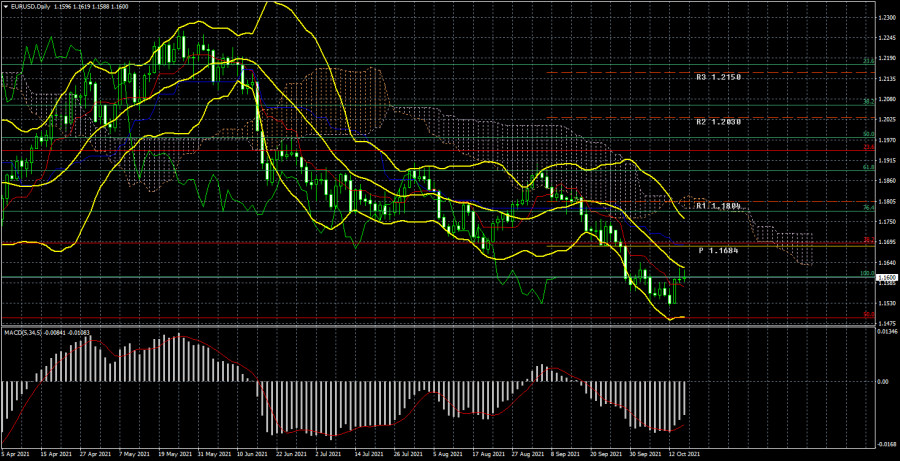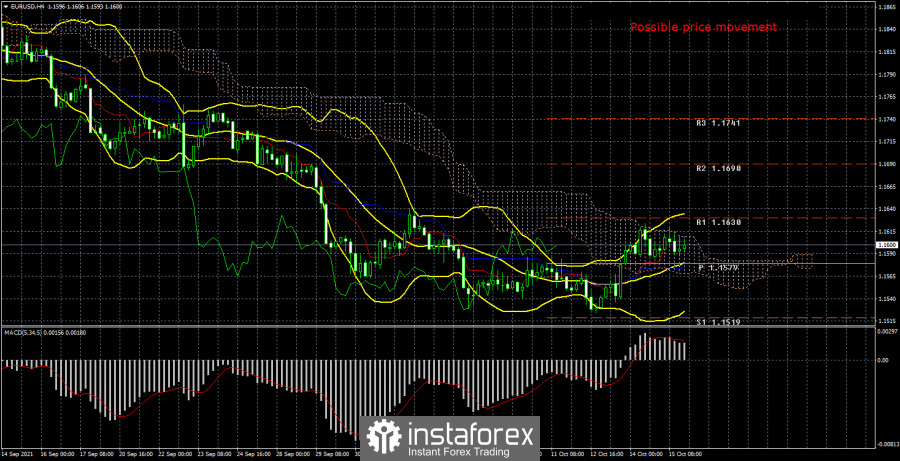
The European currency, paired with the US dollar, tried to start a new upward trend last week. Bollinger bands began to expand upwards. However, so far, the bulls have not managed to overcome the Ichimoku cloud, or instead, its upper line Senkou Span B. Recall that this line is quite important and strong, so a rebound from it can provoke a resumption of the downward trend. However, let's not get ahead of ourselves. By and large, now the price is between two important lines - Senkou Span B and Kijun-sen. Based on this, we can expect the continuation of the movement. Recall that we have long questioned the validity of the strengthening of the US currency. And over the past few weeks, from our point of view, the chances of its further growth have become even less. Simply because the Fed is in absolutely no hurry to curtail the QE program, it is precisely the expectations of curtailing this program that is the strongest factor in supporting the US currency over the past month and a half. However, the Fed does not have any actual "hawkish" actions now, and it is far from a fact that something will change on November 3, when the next meeting of the central bank will take place. Thus, the growth of the European currency, which has already adjusted against the upward trend by almost 50% in total, still looks more logical now. Of course, if we consider a 24-hour timeframe, the pair can be in a downward movement for several more weeks to work out the level of 1.1490, which corresponds to 50.0% Fibonacci. There may be an option in which the fall of quotes will continue even longer, to the level of 61.8%, according to Fibonacci. However, if we evaluate the current fundamental and macroeconomic factors impartially, there is no reason for the dollar to grow. However, we remind traders that it is not recommended to trade with technical signals without confirming any hypothesis.
What awaits us next week in the European Union? Nothing important. Recall that no important events have been coming from the EU for a long time. Markets have not reacted to Christine Lagarde's speeches, ECB meetings, and macroeconomic statistics for a long time. And what kind of reaction can we talk about if the pair has been trading with a volatility of 40-50 points per day for several months? Next week, on Wednesday, the EU will publish an inflation report for September. According to experts' forecasts, the consumer price index will be 3.4% y/y, which entirely coincides with the previous month's value. However, even if the actual value does not coincide with the forecast, we do not expect any market reaction to this event. Maximum - 10 points. On Friday, the European Union will publish the business activity index in services and manufacturing for October. In the current reality, these are secondary indicators, and the chances that they will be worked out are even less than inflation. According to forecasts, both indices will decline compared to September, but this decline will not be critical. Thus, we do not expect any reaction to these events either.
It turns out that there will be nothing to pay special attention to in the European Union. Of course, if inflation continues to accelerate, this may give rise in the near future to a new series of speeches and comments from Christine Lagarde, Luis de Guindos, and other ECB representatives. However, they will also provoke a serious price change in the European currency. Once again, we remind you that the most important thing to pay attention to now and start from is the weakest volatility of the euro/dollar pair. Thus, even if a reaction to an event follows, 10 points are not the movement for which traders study the "foundation" and "macroeconomics."
With such weak movements, it is most reasonable to trade on higher timeframes, and traders should remain open for a longer amount of time than usual. In other words, now the trading styles are either "intraday" or "long-term."

Trading recommendations for the EUR/USD pair:
The technical picture of the EUR/USD pair on the 4-hour chart is very clear. The pair is trying to form a new upward trend but is already experiencing serious problems overcoming the Ichimoku cloud. Thus, if traders manage to overcome the Senkou Span B line next week, it will be possible to buy the pair more confidently and actively. The targets will be scattered up to the 1.1700 level. Given the current volatility, 100 points per week may even be a lot. If the price is fixed back below the critical line and an outright flat does not begin, we advise you to sell the pair again with targets near the level of 1.1490.
Explanations to the illustrations:
Price levels of support and resistance (resistance /support), Fibonacci levels - target levels when opening purchases or sales. Take Profit levels can be placed near them.
Ichimoku indicators (standard settings), Bollinger Bands (standard settings), MACD (5, 34, 5).
The material has been provided by InstaForex Company - www.instaforex.com