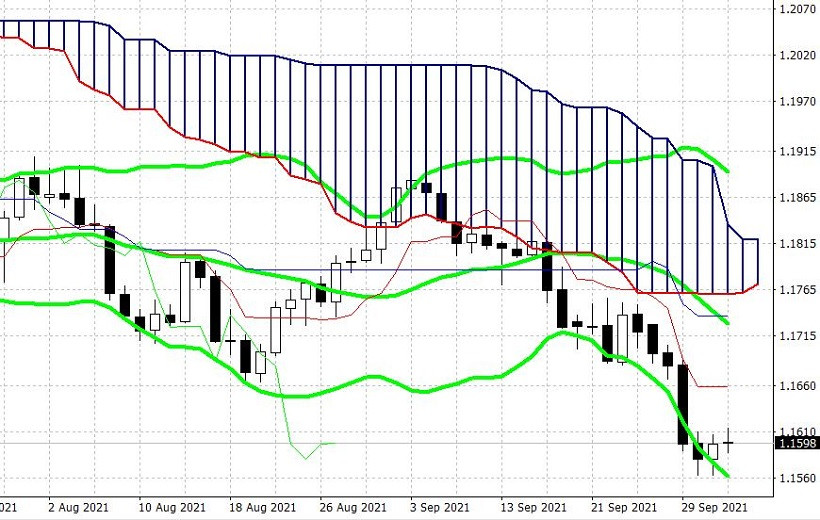
The EUR/USD pair started the new trading week in almost the same positions where it ended trading last Friday – at the border of 1.15 and 1.16 levels. Bears have formed a price bottom - 1.1560, which corresponds to the lower line of the Bollinger Bands indicator on the daily chart. This resistance level is now the main price barrier for sellers.
In general, the downward trend still dominates the pair, as the price has been consistently falling throughout September. The four-week prolonged movement is primarily due to traders' "hawkish" expectations, which are supported by the growth of the oil market (a barrel of Brent crude is trading around the $ 80 mark) and the corresponding comments of some Fed representatives (in particular, James Bullard allowed a double rate hike in 2022).
In other words, the pair retains the potential for further decline at least to the above support level. The euro is under pressure from a negative fundamental background – Christine Lagarde's recent "dovish" comments and many of her colleagues have put quite a lot of pressure on the euro despite the inflation growth in the eurozone. Therefore, EUR/USD traders should focus only on American events, in the context of a possible corrective price recovery.

That is why this week's main event is the Nonfarm data. The key data on the labor market will determine the vector of movement of the US currency. In turn, all other releases will be secondary.
It can be recalled that the August Nonfarms disappointed dollar bulls. Many indicators of the US labor market have significantly sagged, after months of consistent growth. For example, the rate of increase in the number of people employed in the non-agricultural sector has consistently increased for four months, starting in mid-spring. The US economy "gave out" 278 thousand new jobs in April, 580 thousand in May, 938 thousand in June (the June figure was revised upward from the previous value of 850 thousand), and slightly more than one million (the July indicator was also revised upward from the initial value - 943 thousand) in July. But in August, the indicator sharply plummeted: it rose to only 235 thousand with the forecasted growth of 720 thousand. In the private sector of the economy, the indicator came out at almost the same level – 243 thousand with a forecast of growth to 665 thousand. If the key indicators also disappoint traders this week, buyers of EUR/USD will have a reason to make an impressive upward correction. Otherwise, the downward trend will continue.
Based on the preliminary forecasts, September labor market data will support the US currency. In particular, the unemployment rate should drop to 5.1% (one and a half year minimum). Meanwhile, the average hourly wages are expected to rise 0.5% on a monthly basis and 4.6% on an annualized basis. If salary figures go into the green zone, inflationary expectations of investors will rise again. The growth of the oil market, problems in supply chains, and an increase in average wages are the factors that cause the inflationary spiral to unwind more. The headline indicator, reflecting the increase in the number of people employed in the non-agricultural sector, should also reach a "decent" level, reflecting the creation of half a million jobs in September. In the manufacturing sector, as well as in the private sector, indicators should similarly demonstrate positive dynamics.
The rest of the macroeconomic publications this week will play a secondary role for the EUR/USD pair. Today, the economic calendar is almost empty. But at the same time, the US dollar may react to the growth of the oil market, which in turn, is awaiting the outcome of today's OPEC+ meeting, at which producers may decide to increase production in November. If the parties do not come to such a decision, oil's price will rise again, pulling the US currency.
On Tuesday, the final estimates of the manufacturing PMI indices of Germany, France, Italy, and the entire eurozone will be published. According to the forecast, the final estimates of these indices will coincide with the preliminary values, so it is unlikely that these releases will have any impact on the pair. However, the US ISM index of business activity in the service sector may provoke volatility. The indicator is expected to decline to 59 points.
After that, the focus on Wednesday will be the report on the growth of the labor market from the ADP agency (a kind of "harbinger" of Nonpharm) and the speeches of the representatives of the Fed: Raphael Bostic and John Williams.
On Thursday, the minutes of the ECB's last meeting will be published. This is a very interesting document that can reflect the dominant sentiment in the camp of the European Central Bank. If the majority of ECB members expressed cautious and pessimistic assessments (which is most likely), the euro will be under additional pressure.
In addition to Nonfarm data on Friday, one should also pay attention to the Chinese index of business activity in the services sector from Markit, which is expected to rise to 49 points.
In general, the US dollar may gradually strengthen its positions this week while waiting for good data on the US labor market. The oil market may provide additional support to it if oil quotes rise again after the meeting of the representatives of the OPEC + countries.

The technical picture for the EUR/USD pair still indicates the priority of short positions. On the daily chart, the price is located between the middle and lower lines of the Bollinger Bands indicator and below all the lines of the Ichimoku indicator, which shows a bearish "Parade Line" signal. The first downward target is the level of 1.1560 (the lower line of the Bollinger Bands indicator on the daily chart). The next target is at 1.1530 (the lower line of the Bollinger Bands indicator coinciding with the lower border of the Kumo cloud on the weekly chart). After breaking through these targets, the main price barrier will be the level of 1.1500.
The material has been provided by InstaForex Company - www.instaforex.com