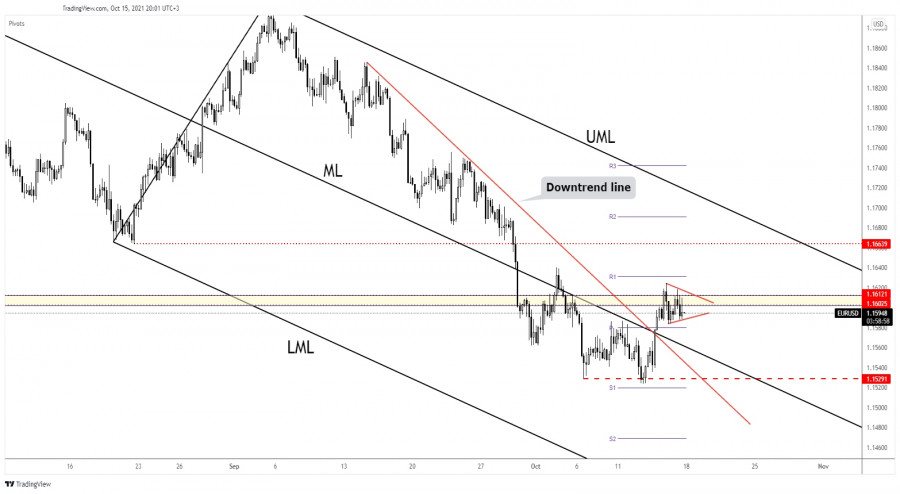
The EUR/USD pair moves somehow sideways in the short term trying to accumulate more bullish energy before jumping higher. As you already know, the Dollar Index is into a short-term correction, so a further drop could help the pair to approach and reach new highs.
EUR/USD decreased a little as the Eurozone Trade Balance was reported at 11.1B below 14.1B expected. On the other hand, the US data has come in mixed. The Retail Sales rose by 0.7% beating a 0.2% drop forecasted, while the Core Retail Sales increased by 0.8% versus 0.5% expected.
Unfortunately for the USD, the Empire State Manufacturing and the Prelim UoM Consumer Sentiment indicators were reported worse than expected.
EUR/USD challenges a resistance zone

As you can see on the H4 chart, the EUR/USD pair stands above the weekly pivot point (1.1579). Technically, the pair was somehow expected to grow after jumping above the downtrend line and above the median line (ML).
Still, you should know that the 1.1602 - 1.1612 area stands as a resistance area. Failing to take out these obstacles could signal a potential decline. The pair may come back to test and retest the broken levels before trying to climb higher.
Jumping and stabilizing above 1.1612 resistance could signal more gains. In the short term, it could move sideways developing a minor triangle. It has failed to reach the weekly R1 (1.1631) or the pivot point (1.1579), so we'll really have to wait for a fresh signal.
EUR/USD forecast
The current sideways movement could represent a continuation pattern if the EUR/USD pair stays above the 1.1579 weekly pivot point. Jumping and closing above 1.1612 could be seen as a long opportunity.
The material has been provided by InstaForex Company - www.instaforex.com