Analysis of previous deals:
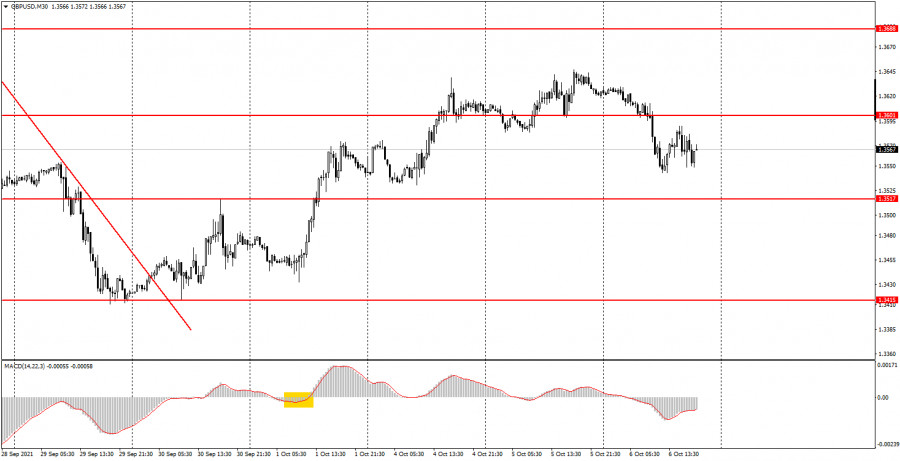
30M chart of the GBP/USD pair

The GBP/USD pair did not move in the best way on the 30-minute timeframe on Wednesday. Even at the current timeframe, you can clearly see that the price has changed the direction of movement at least twice during the day. And this despite the fact that there was no reaction to both macroeconomic reports of the day in Britain and the United States. That is, the markets cheerfully ignored all the statistics of the day, but nevertheless found some reasons and grounds to first stop buying the dollar, and then stop buying the pound and return to buying the dollar. Volatility was not the highest today, but not low either - about 90 points. In addition to not paying any attention to the ADP report on the number of new employees in the US private sector, they also ignored the PMI in the UK services sector. Moreover, the second report can hardly be called strong, but the first showed that the number of new employees in the United States increased by 568,000, although forecasts testified in favor of 425,000, and the value of the previous month was even lower. However, as I said, the markets ignored this data. Also, there is no trend line or channel at this time. Despite the fact that the upward movement continued for four days, the trend clearly lacked pivot points. Now the downward movement began and it became generally unclear whether a new trend had begun or a correction against the old, upward one began.
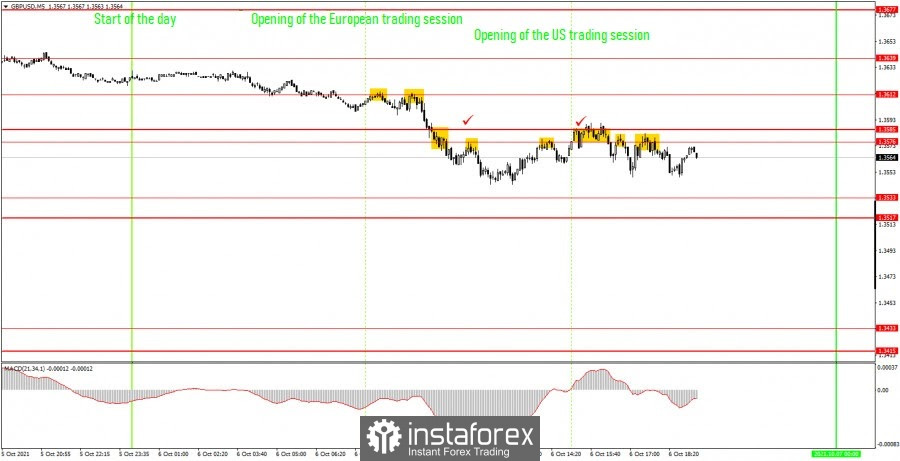
5M chart of the GBP/USD pair

There was also a pretty good move on the 5-minute timeframe on Wednesday, as well as pretty good trading signals. The main thing was that they needed to be properly understood. To begin with, the first two signals - both for sell - were formed at the beginning of the European session, when the quotes bounced off the level of 1.3612. Here, novice traders had to open short positions. Later, the price broke through the levels 1.3576 and 1.3585, which are so close to each other that they had to be considered in a pair as an area of support or resistance. A little later, the quotes bounced down from the level of 1.3576, which was already the fourth consecutive sell signal. In total, since the formation of the first signal, the pair went down 60 points, which was enough to trigger any Take Profit. Thus, beginners earned 40-50 points on this signal. Further, four more sell signals were formed, when the pair bounced either from the level of 1.3576 or from the area of 1.3576 - 1.3585. In principle, it was also possible to open only one short position here, since the price could not settle above 1.3585. Also, the deal was not closed by Stop Loss at breakeven, since this order was not placed. It was not set because the price, after the formation of all signals, could not go down more than 20 points in any way. As a result, the second short position should have been manually closed in the late afternoon at a profit of about 10 points. Thus, today we managed to earn about 50-60 points.
How to trade on Thursday:
There is no clear trend at this time on the 30-minute timeframe. Nevertheless, the pair started a downward movement, which is not yet clear to which trend it belongs. Therefore, signals from the MACD indicator should not be considered for now. The important levels on the 5-minute timeframe are 1.3517, 1.3533, 1.3576, 1.3585, 1.3612. We recommend trading with them. The price can bounce off them or overcome them. As before, we set Take Profit at a distance of 40-50 points. At the 5M TF, you can use all the nearest levels as targets, but then you need to take profit, taking into account the strength of the movement. When passing 20 points in the right direction, we recommend setting Stop Loss to breakeven. There are no major events scheduled for Thursday in the UK and the US, so you will have to trade exclusively on technical signals.
On the chart:
Support and Resistance Levels are the Levels that serve as targets when buying or selling the pair. You can place Take Profit near these levels.
Red lines are the channels or trend lines that display the current trend and show in which direction it is better to trade now.
The MACD indicator consists of a histogram and a signal line. When they cross, this is a signal to enter the market. It is recommended to use this indicator in combination with trend lines (channels and trend lines).
Important speeches and reports (always contained in the news calendar) can greatly influence the movement of a currency pair. Therefore, during their exit, it is recommended to trade as carefully as possible or exit the market in order to avoid a sharp price reversal against the previous movement.
Beginners on Forex should remember that not every single trade has to be profitable. The development of a clear strategy and money management are the key to success in trading over a long period of time.
The material has been provided by InstaForex Company - www.instaforex.com