Bitcoin has been in an upward trend for more than a week, bypassing resistance zones one after another. Over the past few days, the cryptocurrency has managed to approach the upper limit of a wide range of fluctuations in the region of $58k-$60k. However, after touching the $57.2k mark and setting a five-month high, the price began to decline and is already moving towards $58k with less zeal. The reason why this happened is hidden in the technical and on-chain data of BTC, thanks to which it is possible to predict the next local explosion period in the bitcoin market.
*Learn and analyze
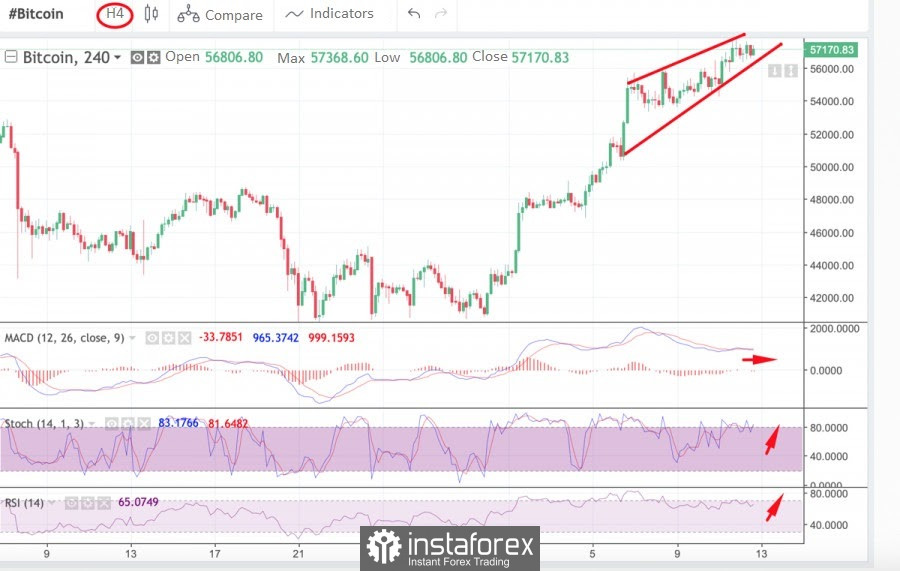
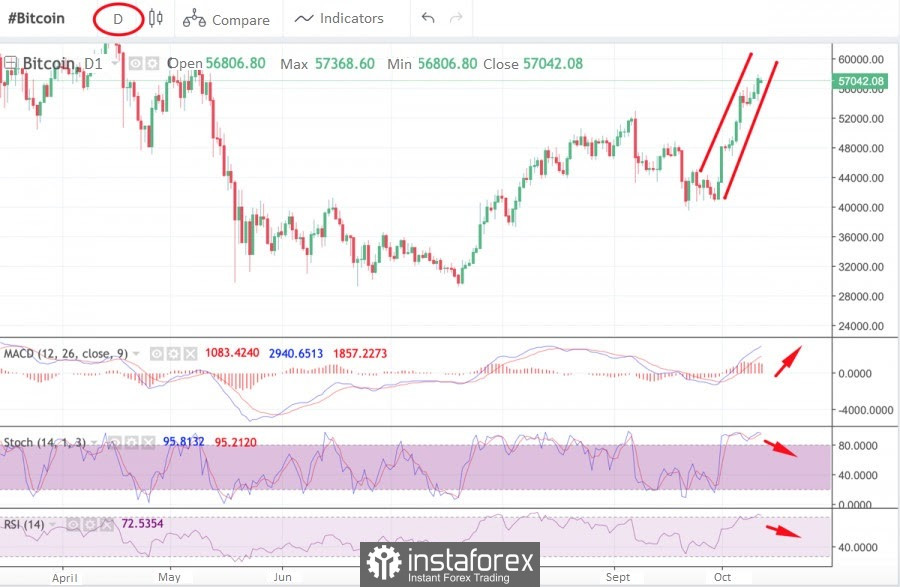
Relative Strength Index (RSI) is a technical indicator that allows you to determine the strength of a trend (downward trend or upward), warns of possible changes in the direction of price movement. Thanks to this metric, you can determine in what stage the asset is - overbought or underbought. The optimal mark for this chart is 60 for a bullish trend. It indicates strong demand for the coin and the strength of the current upward momentum. Upon crossing this mark, the coin begins to move towards overbought.
MACD (Moving Average Convergence Divergence Index) is an indicator that allows you to draw certain conclusions about the trend based on the movement of moving averages and finding the metric values between them. A common bullish signal is the intersection of the white line below the red and bearish, on the contrary, when the white line crosses the red from above, which indicates a downward movement.
Stochastic (Stochastic Oscillator) - the indicator indicates the strength of the momentum of the current prevailing trend. If the indicator is above 80, then the asset can be considered overbought, but if the stochastic is below 20, then this is a signal that the asset is oversold.
Bitcoin quite predictably reached the difficult sales milestone of $58k-$60k and slowed down the growth rate due to increased pressure. In addition, the negative role was played by the news background in the form of statements by the Chinese authorities, which aggravated the already tough sanctions against cryptocurrency companies. As a result, cryptocurrency platforms should complete the liquidation of accounts much earlier than the previous deadline. With this in mind, unrest and even a local sale of assets may begin in the market.
However, the technical charts of the coin report the resumption of the upward movement, which can be seen on the four-hour chart. The MACD indicator is in a sideways movement and completes the formation of a bullish intersection, which may mean the birth of a new impulse for an upward trend. Other technical indicators also show a similar picture: stochastic has completed the formation of a bullish intersection, crossed the 70 mark, and continues to grow. The relative strength index shows similar dynamics and is moving towards the 80 mark, which indicates an increase in the number of purchases. All this is supported by a bullish flag on the four-hour chart, the occurrence of which also foreshadows the continuation of the upward trend.
On the daily chart, the bullish momentum is starting to lose strength, and there are all prerequisites for a downward price reversal. Despite the upward movement of the MACD, other indicators began to decline, showing bearish signals. The stochastic oscillator is at the final stage of forming a bearish intersection, which indicates increased pressure from sellers. The RSI index also began to decline to around 70. The situation on the daily chart can mean both a local correction and price stabilization, since all this time the metrics were in the overbought zone, which is unhealthy for a planned growth. Taking into account the obvious formation of the bullish flag on the daily chart, we are talking about a local pause, after which growth will resume. This is indicated by the on-chain analysis of bitcoin.
* Learn and analyze
On-chain activity is the actions of cryptocurrency market players who independently dispose of their crypto assets, which is why the record goes directly to the main blockchain. These statistics include both private investors and large companies.
Price consolidation is the period when a certain cryptocurrency is located within a narrow horizontal price channel. Usually, this process indicates price stabilization or weakness of market participants (buyers and sellers).
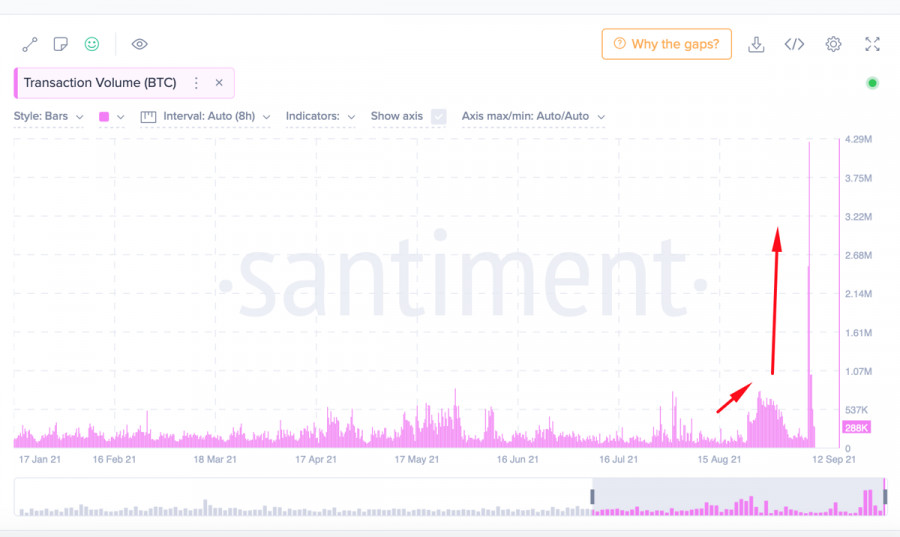
Volume of transactions is an indicator that displays the total volume of transactions made in the bitcoin network by market participants.
MVRV (Market Value to Realized Value) indicator - the indicator displays the ratio of the market and realized value of a particular cryptocurrency. This metric gives a more objective view of the current value of the coin and the period of the market. The indicator also displays the results of the movement of coins: if the value is below 0, then the players moved coins with a loss, and if it is above 0, then investors have made a profit from operations with coins.
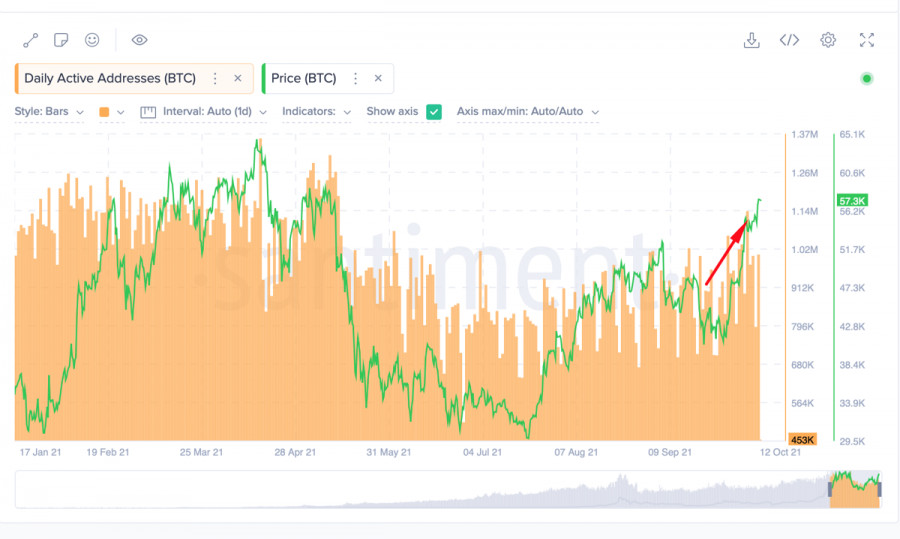
Daily Active Addresses is an on-chain metric that displays the number of unique addresses in contact with the bitcoin network.
The on-chain analysis of the first cryptocurrency indicates the continuation of the upward dynamics and a temporary cycle of accumulation of volumes. Having reached an important resistance milestone, the price began a consolidation phase, which is used by market players. The two main metrics that reflect the bullish mood of investors are the Volume of transactions and Daily Active Addresses. Two days ago, an absolute record of daily transaction volumes was set in the BTC network, which is a direct consequence of the bullish intentions of the market and the growth of the retail audience of the coin. According to the historical growth cycles of the first cryptocurrency, every major bullish rally is accompanied by a surge in retail audience activity. According to the latest data, both on-chain indicators show an upward trend, which indicates interest in Bitcoin, which continues to increase.
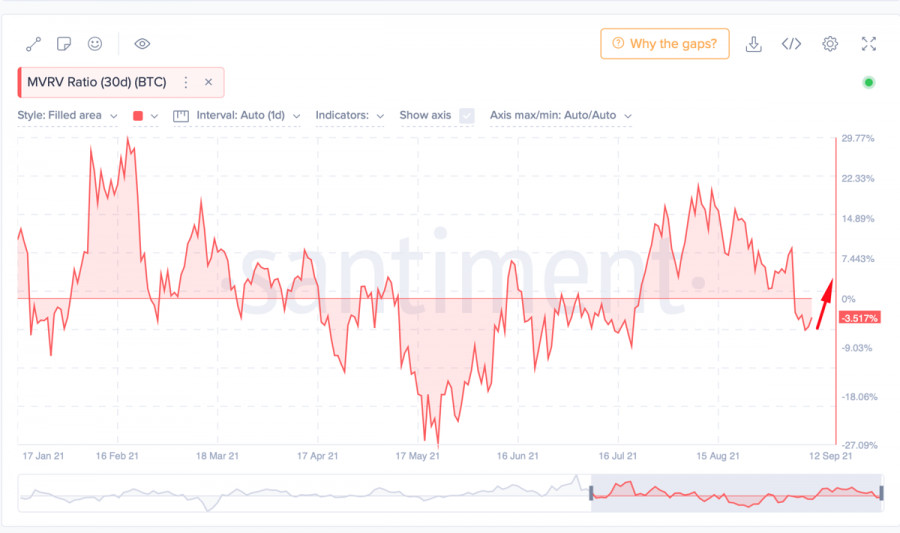
However, the main sign of growing interest in bitcoin remains the indicator of the ratio of the market value of the asset to the realized one. According to this metric, most investors who have bought BTC recently are at a loss. This indicates two fundamentally important signs of growth: the first is that a negative percentage of the metric indicates a significant renewal of the cryptocurrency audience. The second sign is the desire of players who have recently acquired BTC to stay in the asset as long as possible in order to get the maximum profit. This indirectly indicates that most of the fresh investors have entered with long-term or medium-term plans. The MVRV indicator itself has acquired an upward trend and is likely to recover above the zero mark in the near future. Most likely, this will happen after the first crypto asset successfully breaks the $60k mark.
