4-hour timeframe

Technical details:
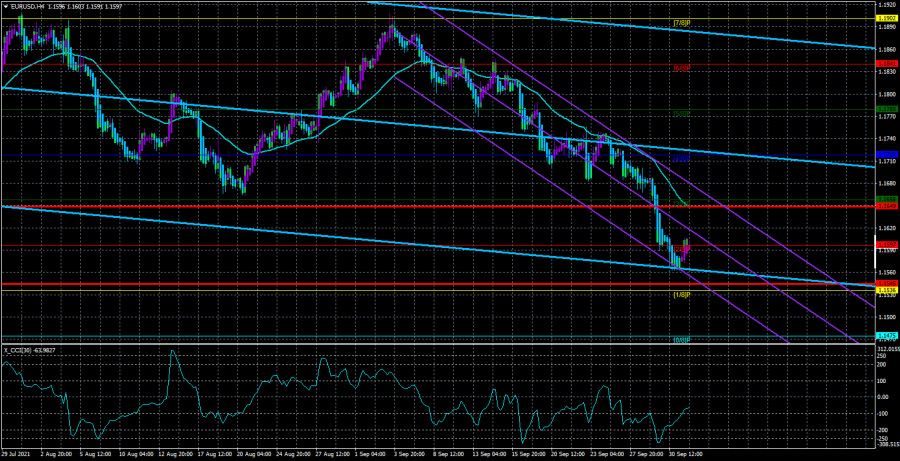
Higher linear regression channel: direction - downward.
Lower linear regression channel: direction - downward.
Moving average (20; smoothed) - downward.
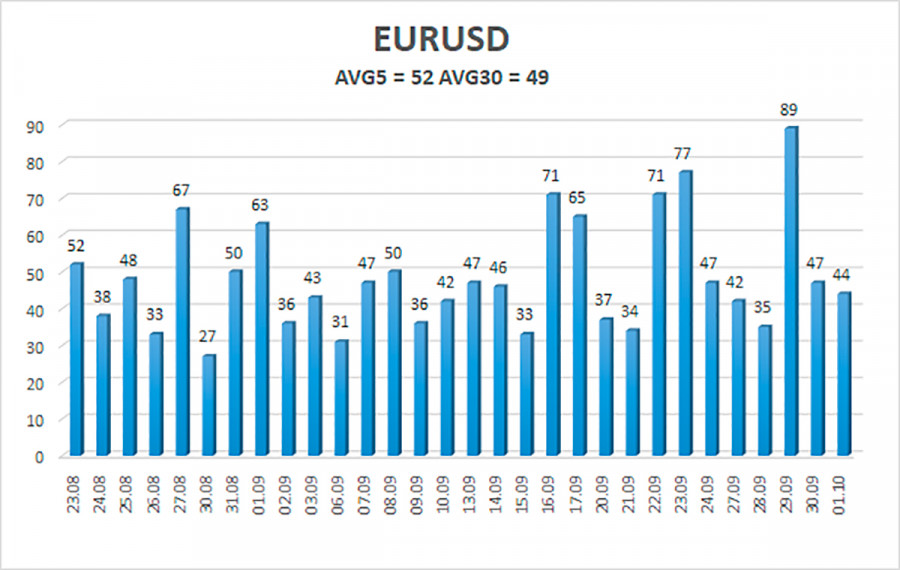
The EUR/USD currency pair broke through the 1.1700 level this week and intensified the downward movement. We cannot say that volatility has sharply increased for the pair. However, there have been several very volatile (in the current conditions) days. The illustration below clearly shows that the pair even set its local record (for the last 30 trading days), passing as many as 89 points on September 29. Recall that the normal average volatility for the pair is 60-80 points per day. Now, both averages are still much lower than this indicator.
Nevertheless, the illustration above clearly shows that the movement has intensified, and the downward trend persists. In previous articles, we have already said that the most likely reason for such a strong strengthening of the US currency is the belief that the Fed will begin to wind down its huge quantitative stimulus program in 2021. The Fed's QE program has larger volumes than the ECB's PEPP program. Thus, the market is facing a potentially greater decrease in cash flow to the American economy than the European one. This factor can support the US dollar. However, from our point of view, all this is just market expectations. We can say that market participants now buy the dollar and sell the euro "in advance." We still do not see how the US dollar can form a new downward trend. Also, recall that the upward trend persists in global terms, and the downward movement in the last nine months can be easily interpreted as a standard 3-wave correction. Thus, despite overcoming the 1.1700 level, we still do not believe the pair can go too far down. However, there is a downward trend, so you should trade down.
There was a lot of "foundation" this trading week, and there was practically no "macroeconomics." None of the speeches by Christine Lagarde, Jerome Powell, and Janet Yellen caused a corresponding market reaction. From "macroeconomics," we can highlight an excellent report on US GDP and the ISM index in the manufacturing sector. There will also be few macroeconomic statistics in the next trading week. However, some reports are very important. But about everything in order. Everything will begin on Tuesday when the index of business activity in the service sector will be published in the European Union. It is not the most important indicator, and it is not necessary to expect serious changes from it. In the United States, the business activity index in the service sector (ISM) will also be published on this day, which is more significant than its European counterpart. Thus, on Tuesday, all attention is on the ISM index.
On Wednesday, the ECB report from the monetary policy meeting will be published in the European Union. And the most significant day of the week will be Friday, when unemployment data, NonFarm Payrolls, and changes in average wages will be published in the United States. Thus, if the markets will react to the statistics, it will be on Friday. Recall that the Fed is guided by the state of the labor market and inflation when making decisions on monetary policy. Therefore, the Nonfarm Payrolls report is of great importance in the local sense of the word and the global one. The latest labor market report for August was not that weak but much weaker than the previous two. Therefore, the markets immediately started talking about the decline in the pace of recovery of the American economy.
Moreover, this week, Fed Chairman Jerome Powell said that the labor market is still very far from the levels of maximum employment. Accordingly, the new Nonfarm report will be of great importance. If it again falls short of forecasts, which amount to 460-475 thousand, it may mean that the Fed may postpone the decision to start curtailing the QE program from November to December. If the actual value is in line with the forecast or exceeds it, this will further increase the chances of QE curtailing at the next Fed meeting and provide local support for the US currency.
However, until Friday, the pair will move almost without the influence of statistics and the "foundation." Thus, in the first four trading days of the week, we will understand whether the markets are set to continue buying the US dollar? If the growth of the US currency continues, then it will be possible to talk about the influence of the global factor that we talked about in the first paragraph. If not, then the markets rely solely on local factors when making trading decisions.

The volatility of the euro/dollar currency pair as of October 3 is 52 points and is characterized as "average." Thus, we expect the pair to move today between the levels of 1.1545 and 1.1649. The reversal of the Heiken Ashi indicator back down will signal the resumption of the downward movement.
Nearest support levels:
S1 – 1.1536
S2 – 1.1475
S3 – 1.1414
Nearest resistance levels:
R1 – 1.1597
R2 – 1.1658
R3 – 1.1719
Trading recommendations:
The EUR/USD pair started a weak correction on Friday. Thus, today, we should consider new options for opening short positions with targets of 1.1545 and 1.1536 after the reversal of the Heiken Ashi indicator down. Purchases of the pair should be opened if the price is fixed above the moving average line with targets of 1.1719 and 1.1780. They should be kept open until the Heiken Ashi indicator turns down.
The material has been provided by InstaForex Company - www.instaforex.com