Analysis of GBP/USD 24-hour TF.

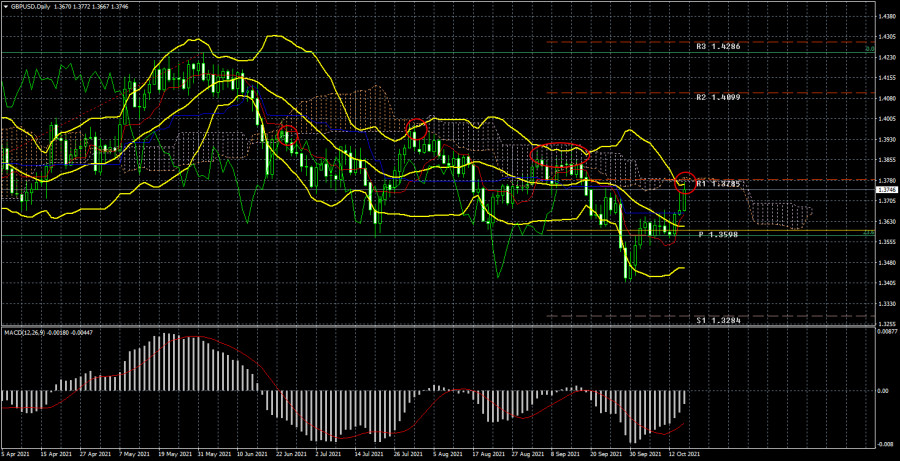
The GBP/USD currency pair has been showing an upward movement for the third week in a row, while EUR/USD continues to move down. Thus, there is now a correlation between the two main pairs. And it is important to understand its causes to understand the prospects of both currency pairs in the near future. First of all, we pay attention to the fact that the pound has adjusted against the global upward trend by only 30% or so. Second, we would like to note that traders have tried to resume the upward trend at least three times, but the price bounced off the Senkou Span B line each time. In other words, traders could not overcome the Ichimoku cloud. Thus, the current downward movement still looks like a correction, and the pair's quotes have again reached the Senkou Span B line. A rebound from this line may provoke a new round of downward movement, within which the pair may fall to the level of 1.3400 and below. If this line is finally overcome, then the pair can begin to form a new upward trend, as we expect.
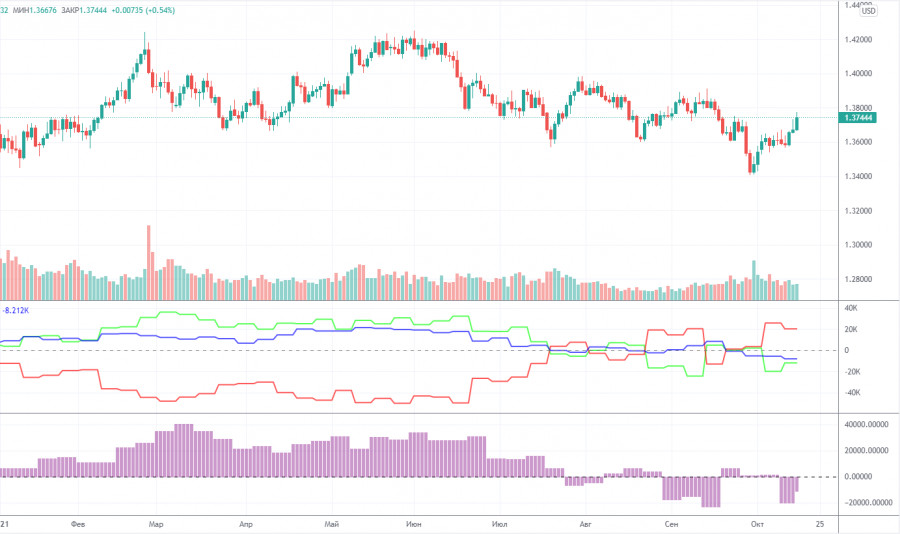
It should be noted that no particularly positive news has been received from the UK over the past three weeks. Thus, it is hardly possible to link the current growth of the pound with the fundamental background. Britain had no good news, and the US data should have had the same effect on the euro/dollar and pound/dollar pairs. However, recall that the euro continues to fall, and the pound has been growing for the third week. Thus, it seems that global factors are interfering again, which at one time (in 2020) raised the pound to its peaks in 3 years and did not allow it to go down far. The illustration below shows how weakly the pound has adjusted over the past 6-7 months and how fragmented the data of COT reports look.
Analysis of the COT report.

During the last reporting week (October 5-11), the mood of professional traders again became less "bearish." Major players closed 1.7 thousand contracts for purchase and 10.6 thousand contracts for sale during the week. Thus, the net position of professional traders has grown by almost 9 thousand, which is quite a lot for the pound. In principle, such a change in the mood of major players correlates well with how the pair moved during the same period. The pound was growing, so it's reasonable to assume that the big players were buying it, not selling it. However, we are most interested in the general trend in COT reports. It is how non-commercial traders behave over a long distance. And now let's look at the first indicator, especially its movements over the past three months. The green and red lines (net positions of non-commercial and commercial traders) constantly change the direction of movement, cross each other, cross the zero mark. It suggests that there is no clear mood among the major players right now. It is constantly changing, which means there is no trend now.
Moreover, if you look at the pair's movements over the past 6-7 months, it is also clearly visible that the minimum downward trend is present. However, the quotes spent most of their time between the 36th level and the 42nd. Thus, from our point of view, COT reports now do not provide an opportunity to predict the further movement of the pair.
Analysis of fundamental events.
There were many macroeconomic publications in the UK this week, but what difference does it make if most of them were ignored? The unemployment rate, average earnings, GDP for August, and industrial production were published. The first two reports turned out to be better than forecasts, but the British currency fell at the end of the day on Tuesday, not rose. The second two reports turned out to be the opposite, but just on Wednesday, the pound rose quite a lot. Therefore, we do not believe that the markets have paid any attention to this data at all. It should also be noted that the pound can continue to grow based on the fact that the fuel situation in the country has improved. After all, the UK government has involved the military in solving the problem, simplified obtaining work visas for drivers from other countries, and abolished the mandatory three-day certification for its drivers. However, the pound has been growing for more than two weeks. It is unlikely that the markets are buying the pound based on this factor alone. And there is little other news from Britain right now. And there are no positive ones among them.
Trading plan for the week of October 18 - 22:
1) The pound/dollar pair has returned to the Ichimoku cloud again and will try to gain a foothold above it again next week. If it succeeds, then the trend may change to an upward one, and in this case, we recommend buying the pair since the probability of forming a new upward trend will increase significantly. The first target will be the resistance level of 1.4099.
2) Bears are still holding the initiative in their hands, as the price is still located below the Ichimoku cloud. Nevertheless, the critical line has been overcome, so we do not recommend selling the pound at this time. If there is a rebound from the Senkou Span B line, and the price is fixed below the Kijun-sen line, we recommend selling the pair again with a target of 1.3400.
Explanations to the illustrations:
Price levels of support and resistance (resistance /support), Fibonacci levels - target levels when opening purchases or sales. Take Profit levels can be placed near them.
Ichimoku indicators(standard settings), Bollinger Bands(standard settings), MACD(5, 34, 5).
Indicator 1 on the COT charts - the net position size of each category of traders.
Indicator 2 on the COT charts - the net position size for the "Non-commercial" group.
The material has been provided by InstaForex Company - www.instaforex.com