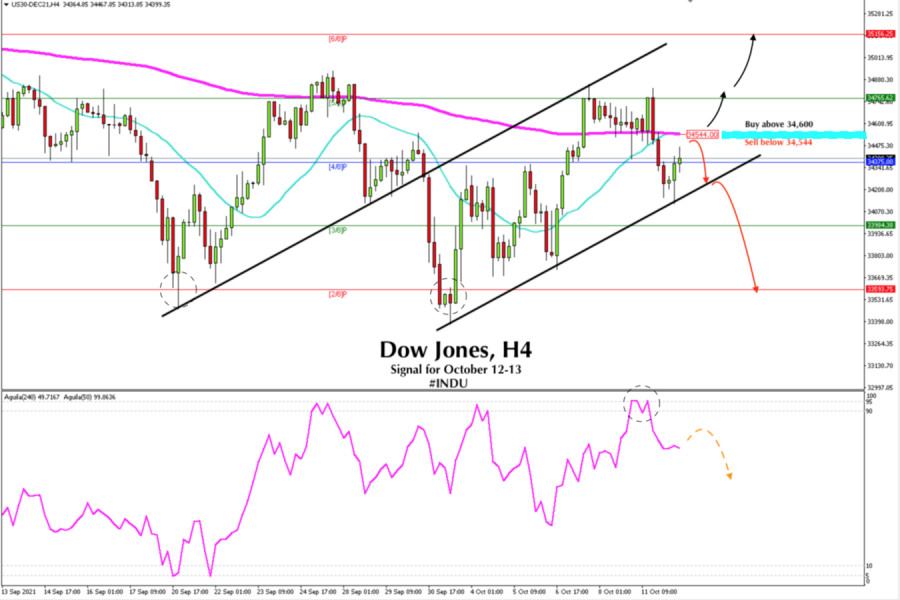
The Dow Jones Industrial Average (#INDU) remains below the SMA of 21 and below the EMA of 200 together located at 34,544, after having consolidated since October 8 above these moving averages. Now the Dow Jones is trading below these, and it could be a negative sign in the short term.
The main trend is still bullish according to the 4-hour chart. However, it may face a barrier at the 200 EMA (34,544). In the last hours, it has made a bounce at the lower line of the bullish channel, which could give the Dow Jones momentum to overcome this resistance. If it fails to consolidate above 34,600 then it will be a good opportunity to sell with targets at 34,200 and up to 33,984 (3/8).
A sustained move above 34,600 will indicate that industrial stocks are doing well and for us, it will be an opportunity to buy. The target can be placed at 34,765 and up to the 6/8 Murray level at 35,156.
Conversely, a breakout of the bullish channel and a consolidation below 34,200 may signal confirmation of the strength of the 200 EMA and could exert pressure and push the price to the key level of 2/8 Murray around 33,593. This zone is very strong because it was tested on September 20 and 30, with the result of a strong technical rebound. You can see it in the chart above.
In view of the fact that the Dow Jones is trading below the 200 EMA and the 21 SMA, our forecast is negative. There is a probability that the quotes will continue to fall in the short term. We need to wait for the confirmation of the break of the bullish channel to sell with targets at 33,593 (2/8).
The oscillator of the Eagle indicator has reached the 95-point level, showing an overbought signal, with an imminent downward correction. On the 4-hour chart, we can see that this has occurred, but the downward pressure could increase and could fall to the immediate support of 33,984 (3/8).
Support and Resistance Levels for October 12 - 13, 2021
Resistance (3) 35,006
Resistance (2) 34,678
Resistance (1) 34,999
----------------------------
Support (1) 34,171
Support (2) 33,905
Support (3) 33,593
***********************************************************
Trading tips for Dow Jones for October 12 - 13, 2021
Sell below 34,544 (EMA 200) with take profit at 34,171 and 33,984 (3/8), stop loss above 34,600.
Buy in case of a breakout at 34,600 (EMA 200) with the take profit at 34,765 and 35,156 (6/8), the stop loss is below 34,520.
The material has been provided by InstaForex Company - www.instaforex.com