Wave pattern
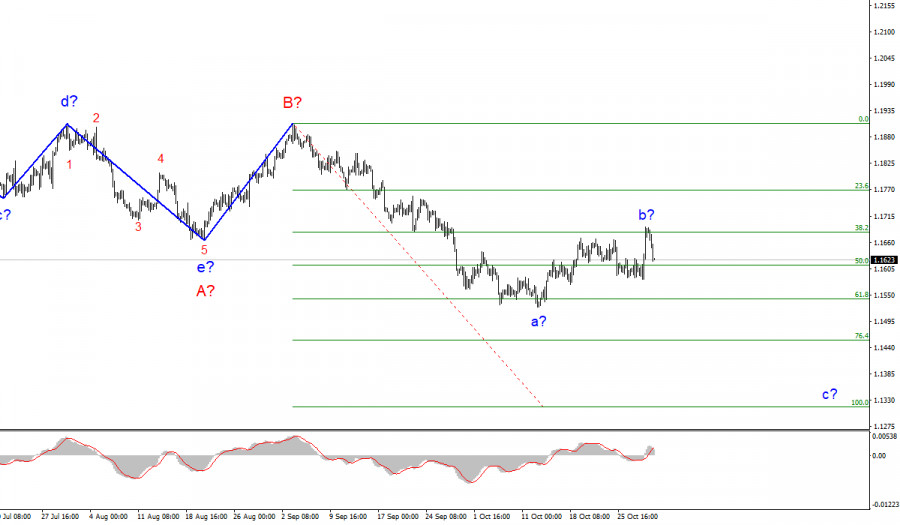
The wave counting of the 4-hour chart for the Euro/Dollar instrument looks quite holistic now. The a-b-c-d-e trend segment, which has been forming since the beginning of the year, is interpreted as wave A, and the subsequent increase of the instrument is interpreted as wave B. If this assumption is correct, then the construction of the proposed wave C has now begun and is continuing, which can take a very extended form. The corrective wave b took a more complex form due to the sell-off of the US currency on Thursday, but now the decline in quotes has resumed. Thus, wave b looks complete again.
If this is indeed the case, then the construction of wave c has now begun, which can also turn out to be very long. Thus, the targets are located below the 15th figure to the 13th. An unsuccessful attempt to break through the 1.1681 mark, which corresponds to 38.2% Fibonacci level, indicates the readiness of the markets to build a new downward wave.
New important statistics from the European Union.
The news background for the EUR/USD instrument was quite strong on Friday. Note that on Thursday, the ECB announced the results of its meeting, and the US GDP report was released. Moreover, the first event supported the European currency, and the second caused a decrease in demand for the dollar. As a result, we saw a fairly strong increase in the instrument, although this did not correspond to the wave counting. However, the decline in quotes has resumed Friday, and the instrument has lost 65 pips to the current moment. Also, the reports on inflation and GDP in the European Union have been released. And both turned out to be quite unexpected.
In recent months, inflation in the EU has not grown too much, but by the end of October, it accelerated to 4.1%, although the markets did not expect a value above 3.7%. The same applies to core inflation, which accelerated to 2.1% against expectations of 1.9%. However, where the US dollar could rise, the euro currency declined. Most likely, the markets ignored statistics from the European Union altogether, since the second report on GDP was certainly supposed to cause an increase in the euro. However, it did not have any effect on the mood of the markets, and the euro continued to decline.
The European economy grew by 2.2% QoQ in the third quarter, and the markets were expecting an increase of 2.1%. Thus, a positive report from the Eurozone could not cause a sell-off of the euro currency. The refusal of the markets to pay attention to European statistics, combined with an unsuccessful attempt to break through the level of 1.1681, indicates high chances of continuing the decline of the instrument.
General conclusions
Based on the analysis, I conclude that the construction of the downward wave C will continue, and its internal corrective wave has completed its construction. Therefore, now I advise you to sell the instrument for each signal from the MACD "down," with targets located near the calculated marks of 1.1454 and 1.1314, which corresponds to 76.4% and 100.0% Fibonacci levels. A new resumption of the increase in quotes may complicate the current wave counting, and wave b will take an even longer form.
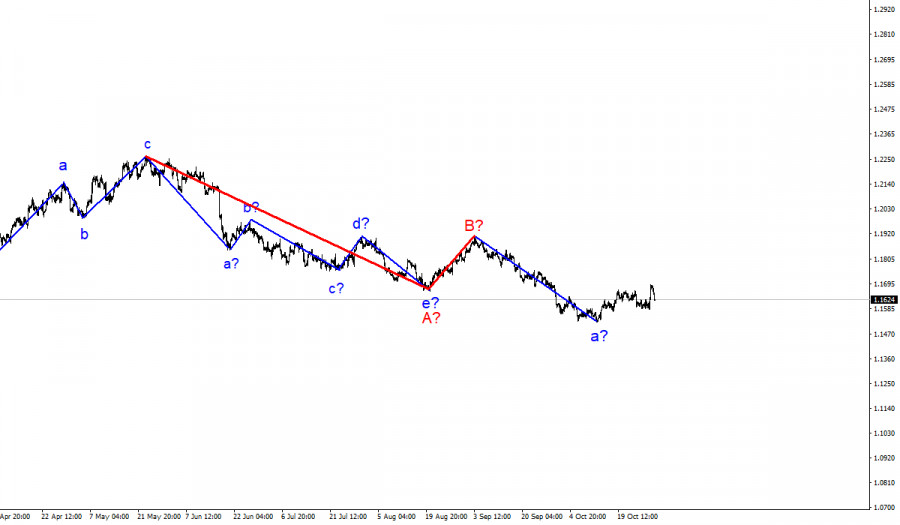
The wave counting of the higher scale looks quite convincing. The decline in quotes continues and now the downward section of the trend, which originates on May 25, takes the form of a three-wave corrective structure A-B-C. Thus, the decline may continue for several more months until wave C is fully completed.
The material has been provided by InstaForex Company - www.instaforex.com

