Wave pattern
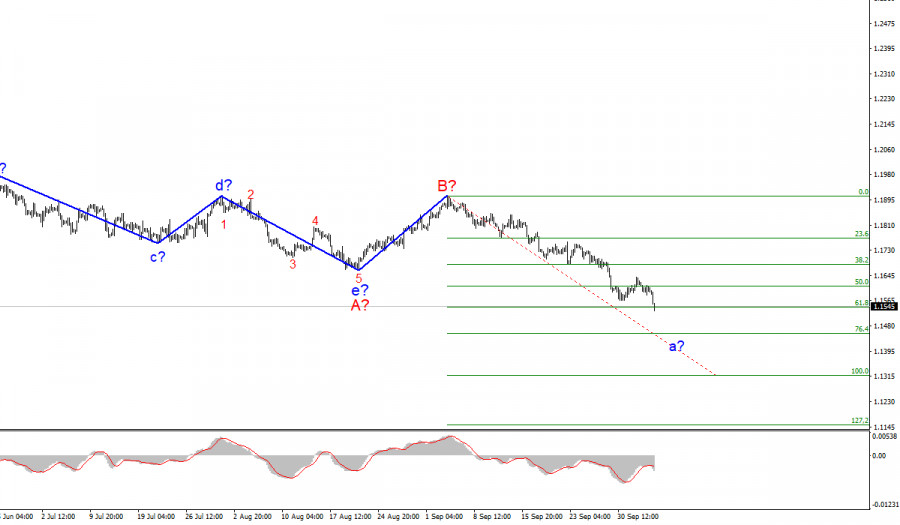
The wave counting of the 4-hour chart for the Euro/Dollar instrument undergone certain changes after the quotes fell below the low of the previous wave. The construction of the downward trend section has resumed at the moment. Thus, now the a-b-c-d-e trend segment, which has been formed since the beginning of the year, is interpreted as wave A, and the subsequent increase in the instrument is interpreted as wave B. If this is indeed the case, then the construction of the supposed wave C has now begun, which can take a very extended form, given the size of wave A. At the same time, the entire section of the trend may again take a corrective, three-wave form A-B-C. Thus, the probability of further decline of the instrument remains high, since only one wave is visible inside wave C, but it should turn out to be at least three wave. At the moment, there are no signs of building even a corrective wave b.
ISM index and ADP report came out strong; what will happen to Nonfarm Payrolls?
The ISM services PMI report released Tuesday turned out quite strong. Today, the ADP National Employment Report also posted strong gains better than the previous month's value and market expectations. The report showed employment in the private sector increased by 568,000, which exceeded the markets' expectations of 425,000. At first glance, today's demand for the US currency grew quite naturally – for the second day in a row, America pleases the markets with strong statistics. But if you look closely, then all the movement of the instrument down during the day happened before the release of the ADP report, and after its release, the increase in the price of the US currency just stopped.
What does this mean? Firstly, the fact that the ADP report has not caused any reaction from the markets for the umpteenth time. Note that the markets pay the most attention to the Nonfarm Payrolls report, which will be released on Friday. Secondly, that the reasons for the dollar's rise should be sought somewhere else, and not tied to the economic news background. A good explanation for what is happening can be the same wave pattern, which, after making adjustments, clearly points down. Also, the reason for such a confident strengthening of the dollar may be the high probability of the completion of the Fed's stimulus program this year.
General conclusions
Based on the analysis, I conclude that the construction of the downward wave C will continue for some time. Therefore, now I advise selling the instrument for each downward signal from the MACD, with targets located near the calculated marks of 1.1608 and 1.1540, which corresponds to 50.0% and 61.8% Fibonacci levels. The supposed wave b in C has ended, even before it has begun, so now the construction of wave a in C resumes. Nevertheless, an unsuccessful attempt to break through the 1.1540 mark, which corresponds to 61.8% Fibonacci level, may indicate that the markets are not ready to continue selling the instrument.
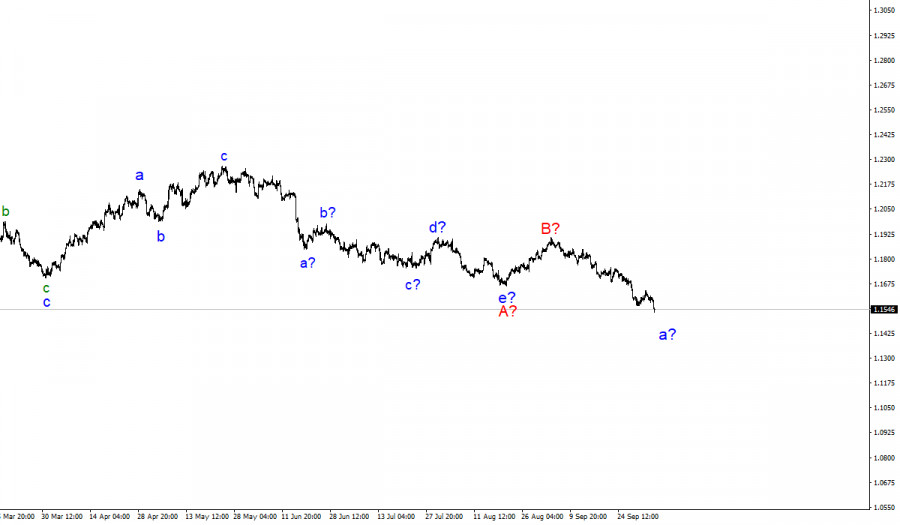
The wave counting of the higher scale looks quite convincing. The price decline continues and now the downward section of the trend, which originates on May 25, takes the form of a three-wave correction structure A-B-C. Thus, the decline may continue for several more months until wave C is fully completed.
The material has been provided by InstaForex Company - www.instaforex.com

