Wave pattern
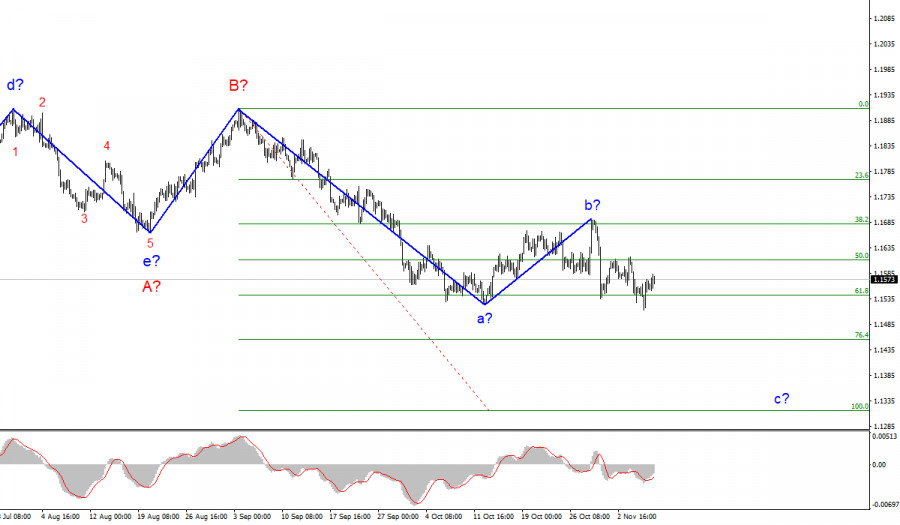
The wave counting of the 4-hour chart for the Euro/Dollar instrument looks quite holistic now. The plot a-b-c-d-e, which has been forming since the beginning of the year, is interpreted as wave A, and the subsequent increase in the instrument is interpreted as wave B. If this assumption is correct, then the construction of the proposed wave C, which can take a very extended form, is now underway.
The corrective wave b has taken a more complex form than initially expected, but the subsequent decline in quotes, which presumably waves c to C, preserves the integrity of the wave counting. Thus, wave b is considered completed at the moment.
The assumed wave c can take no less extended form than wave a. Its targets are located below the 15th figure, up to the 13th. However, in order for this wave to continue its construction, a successful attempt to break through the 1.1541 mark is required, which corresponds to 61.8% Fibonacci level, which is not yet available. The whole wave C can also take a shortened form, but for now, let's consider this option to be a backup.
Nonfarm Payrolls exceeded market expectations for the first time in three months.
The news background for the EUR/USD instrument remained strong on Friday. The American unemployment rate and Nonfarm Payrolls turned out to be much better than traders' expectations. However, the euro saw more gain than the dollar. The instrument managed to add about 15 basis points, although the first half of the day was followed by a decrease of 40 points. And in the afternoon, the increase began, although reports indicated a reverse movement. Therefore, the construction of the proposed wave c in C stalled, although it had every chance to continue.
Thus, we can assume that wave C may turn out to be shortened since even with a strong news background, the instrument could not continue to decline. However, it is still too early to jump to a conclusion. In recent months, the instrument has definitely been moving very slowly, so perhaps this movement will continue in the remaining 2 months of the outgoing year.
This week, the news background promises to be very weak. It was such on Monday – the instrument showed an amplitude of movements of only 15 basis points. During this week, it is unlikely that anything will change dramatically. But let's wait for the scheduled speeches of ECB President Christine Lagarde and Fed Chair Jerome Powell on Tuesday. Also, the report on inflation in America on Wednesday.
General conclusions
Based on the analysis, I conclude that the construction of the downward wave C will continue, and its internal corrective wave b has completed its construction. Therefore, now I advise you to sell the instrument for each "downward" signal from the MACD with targets located near the calculated marks of 1.1454 and 1.1314, which corresponds to 76.4% and 100.0% Fibonacci levels.
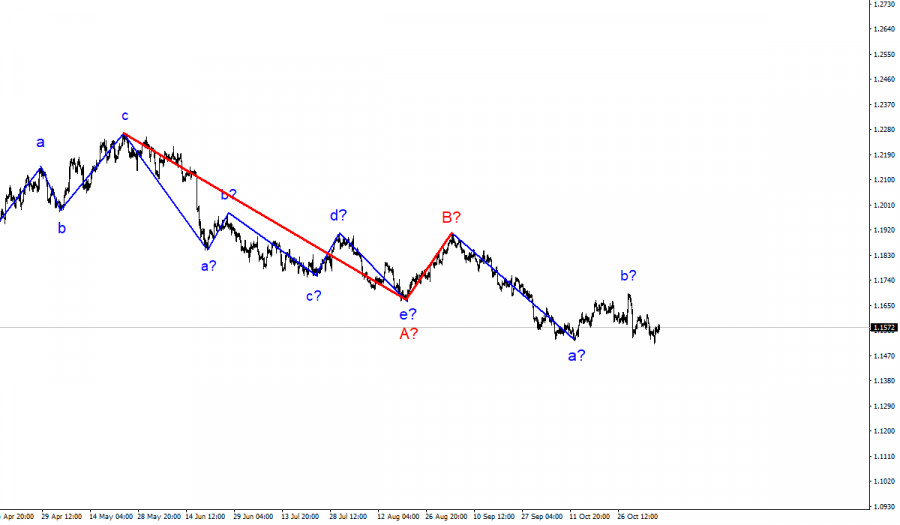
The wave counting of the higher scale looks quite convincing. The decline in quotes continues, and now the downward section of the trend, which originates on May 25, takes the form of a three-wave corrective structure A-B-C. Thus, the decline may continue for several more months until wave C is fully completed.
The material has been provided by InstaForex Company - www.instaforex.com

