Bitcoin remains within the framework of a strong corrective movement; a local rebound should not be misleading. In the near future, the price will continue to be in this area and the probability of a subsequent decline is much higher than the chance of a rebound above $60k. Despite this, positive signals are visible on the charts of the cryptocurrency, which portend the most powerful bullish wave in the last six months.
As of 11:00 UTC, Bitcoin is trading in the region of $57k and has fallen in price by 3% over the past day. It also recorded a weekly drop of 13% with trading volumes in the region of $31 billion.
The news background continues to remain neutral, and the reaction of the retail audience is the main catalyst for the drop in Bitcoin quotes. However, despite local sales, there is no massive profit-taking among the main BTC audience, which is also a bullish signal.
At the same time, the coin needs to continue its recovery through price correction to deeper levels. As of November 22, the price has reached the middle of the liquidity range, which should be fully utilized.
Taking this into account, in the near future, it is necessary to be ready to buy additional coins, since the market gives a unique chance before a rather protracted rise to new historical highs.
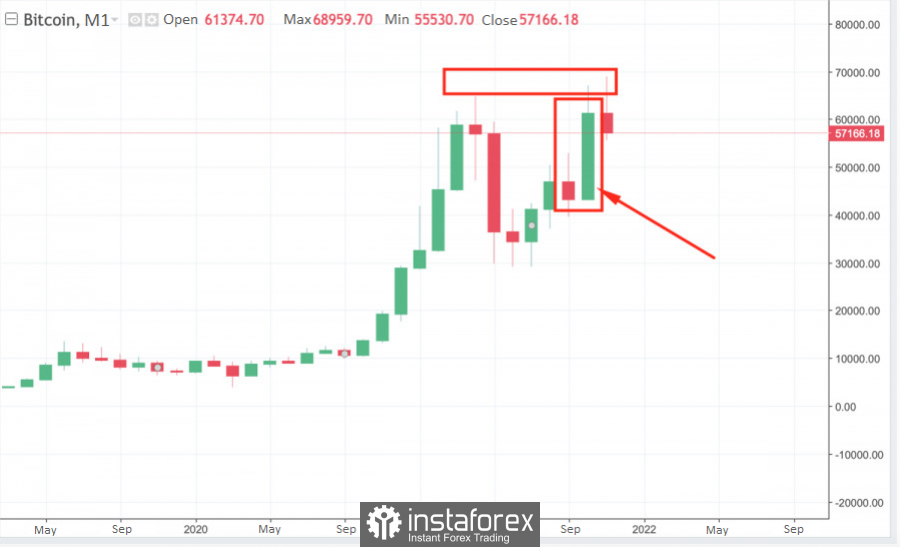
The main signal for the imminent onset of a powerful upward trend is the "bullish engulfing" pattern, which was formed on the monthly candle for October 2021. The chart shows that the closing price of the monthly candlestick is at the level of historical highs, which has been repeatedly tested over the past six months.
By itself, the "bullish engulfing" pattern is a strong signal for growth, and taking into account the closure at the upper border of the previous months, one can expect a protracted rise that will last about a month.
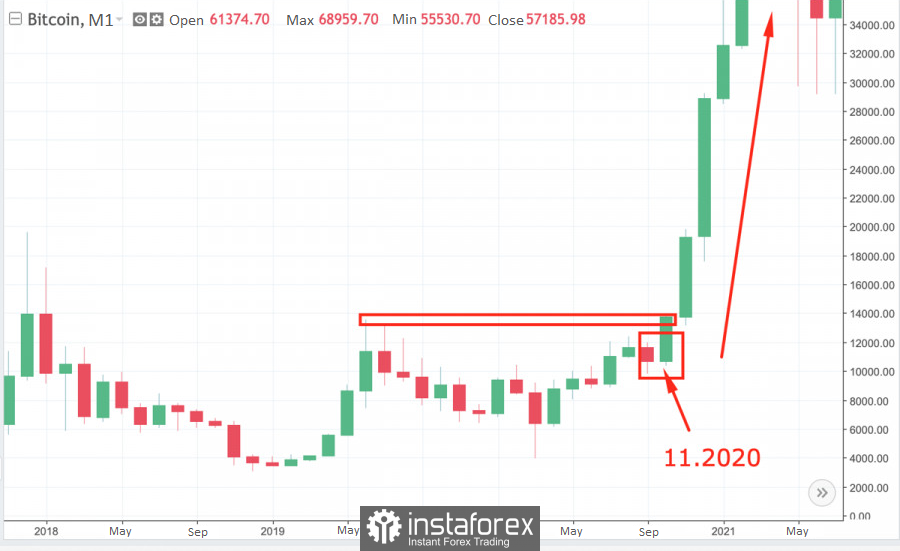
It is also worth looking at a similar situation in October 2020. The chart shows a similar situation, where after a certain period of consolidation, the price also closes at the level of the previous candles and forms an engulfing pattern, which heralds the end of the stabilization period and the start of a new growth cycle.
With this in mind, we should expect a strong bullish rally from BTC in the near future, which will start with a rebound from the $53k-$55k area. The closest stop of the asset will be the $75k line, after which the asset will continue its upward movement to $98k.


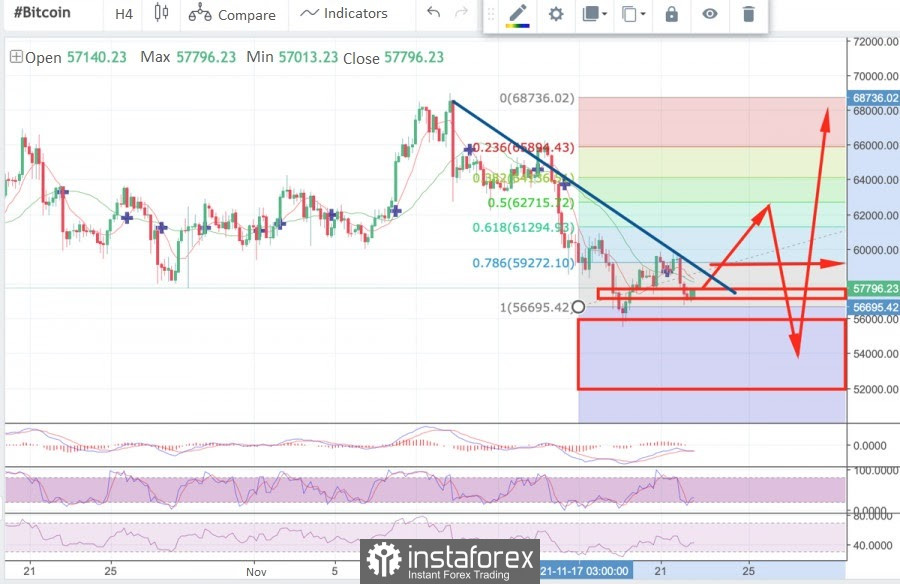
The overall picture is clear and the market is approaching a bullish rally, but in a narrower time frame, the trend is still downward. The price successfully bounced off the Fibo level of 1.56 and continued its upward movement to the next corridor, around the $59.6k mark, where the 50 EMA also takes place.
In case of a bullish breakout, a strong support zone is formed here and the price moves further but rests against the 0.5 Fibo level, which should hold and reverse the price. Since all previous levels of the $56.6k-$59.6k range have been tested, the price will not encounter significant resistance in the downward trend.
In case of breakdown of the $56.6k mark and concurrently the Fibo level of 1.5, Bitcoin will start testing the main range of $52k-$ 55.5k, where, most likely, massive buying and the emergence of a bullish rally to the new ATH will begin.
However, it is worth closely monitoring the market sentiment during a decline, as excessive euphoria or fear can aggravate the price movement in any direction. This is fraught with a correction and a $52k decline, which casts doubt on the medium-term upward trend.
In general, Bitcoin looks very confident, and the market confirms its bullish plans, holding volumes even during a correction.

