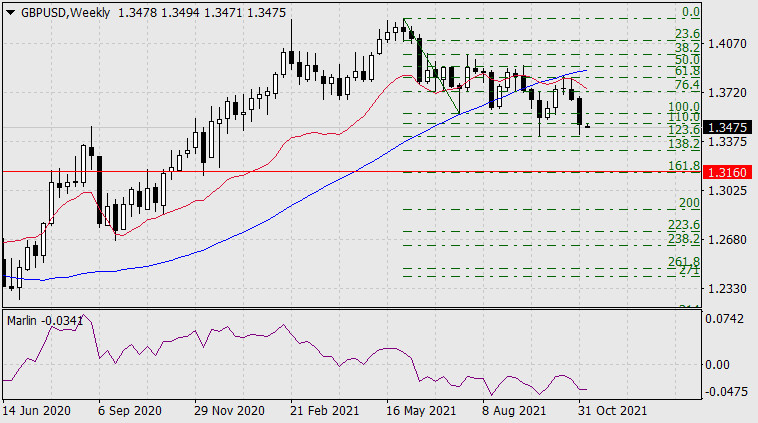
On the weekly chart, the price is steadily declining below the indicator lines, supported by the descending Marlin Oscillator.

The target of the decline is the 1.3160 level - the area of the December 2020 low and the Fibonacci level of 161.8% of the first branch of the June-July 2021 movement.

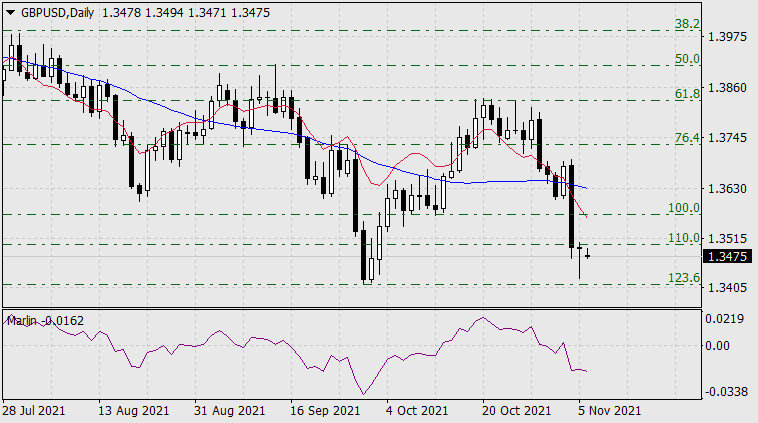
On the daily scale chart, the price settled below both indicator lines - below the balance line and the MACD line, the Marlin oscillator is decreasing in the territory of the downward trend.

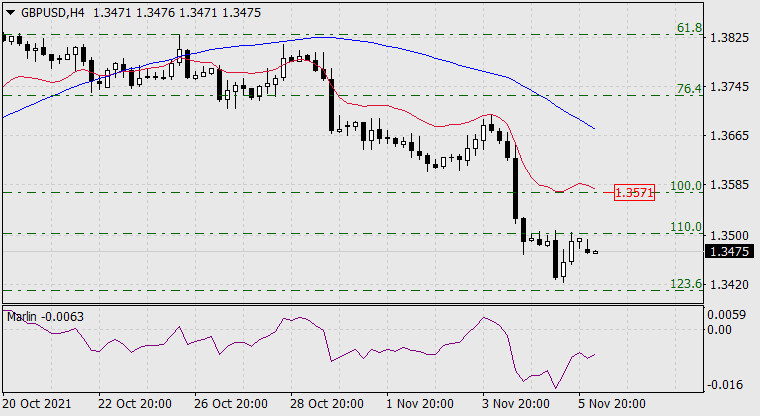
On the H4 chart, the price is trying to break above the Fibonacci level of 110.0%. If it succeeds, then the next target of the corrective growth will be the Fibonacci level of 100.0% at the price of 1.3571. Further, we are waiting for the restoration of the downward movement to the designated target at 1.3160.
The material has been provided by InstaForex Company - www.instaforex.com