The precious metals market is constantly under my scrutiny, and today I have good news for you! It is very likely that, after a year and a half hiatus and a period of decline for precious metals, the good days are finally here. Moreover, I have good reasons for such statements, which I will introduce you to today, focusing on the gold market as the main element of the precious metals market.
First, let's talk about the fundamental background of what is happening. The price of gold is influenced by a number of factors, including but not limited to investment demand, demand from the jewelry industry, demand from the electronics sector, and price momentum. At the same time, in any of these sectors, the influence of US investors will be overwhelming.
The only segment where Asian investors can compete with Americans is demand from the jewelry industry, but even there, the influence of American consumers will be quite tangible. That is why, despite some oversimplification, I pay increased attention to data from the United States as the key data influencing the price of gold and other precious metals.
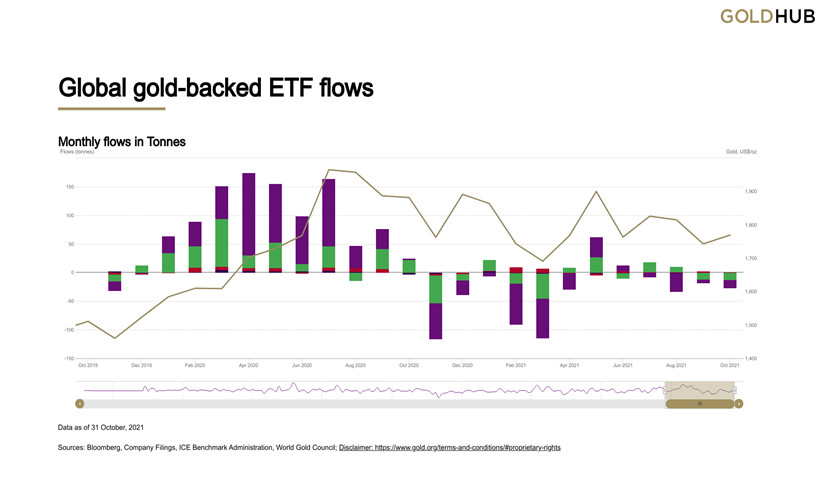
Back in late October and early November, the future of the precious metals market seemed rather hazy. Investors were selling their shares in exchange-traded funds (Figure 1), and demand for gold futures was at its lowest levels since 2016. However, the situation changed with overcoming the level of $1,830 per troy ounce.

Figure 1: Investors buying and selling Gold ETFs
The formal reason for the growth of gold and overcoming the mark of $1,830 was the data on inflation in the United States, which showed a multi-year record. At the same time, there was an increase in precious metals against the background of a simultaneous rise in the dollar, an increase in the yields of government treasury bonds, and a fall in the rate of the European currency.
This came as a complete surprise to many investors, who believed that the rise in bond yields was negative for gold, as well as the rise in the dollar, but gold once again showed its temper, getting rid of both the dollar and American debts.
Let's see why this happened. Despite the fact that gold is denominated in dollars, it wins the dollar over the long run and wins by a wide margin.
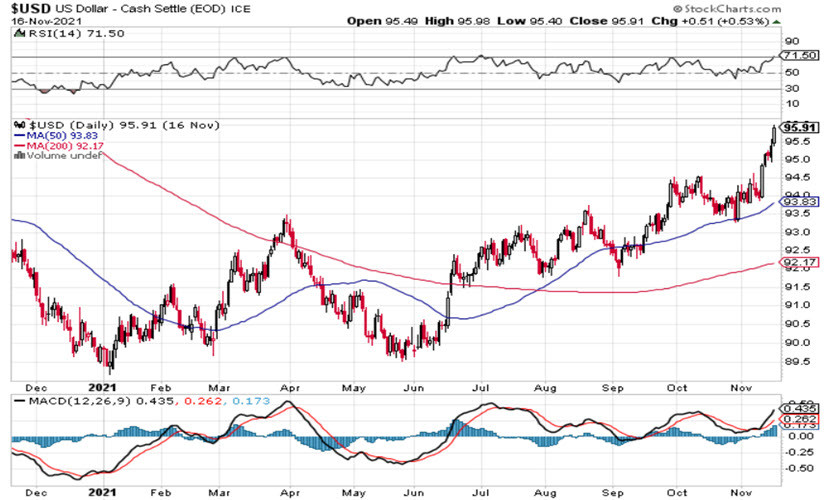
In 1973, gold averaged about $90 an ounce. Now the price of gold is over $1,800. If gold depended only on the dollar, then its value now would not exceed 4% of the value of the 1973 dollar, which follows from the dynamics of the US dollar against a basket of foreign currencies (Fig. 2).

Figure 2: US Dollar Index Against a Basket of Foreign Currencies
The value of the dollar index at the level of 95.91 is the value of the dollar, expressed as a percentage of a basket of foreign currencies. However, gold, as we know, has grown more than 20 times. So long-range peg of gold to the dollar is inherently flawed.
Gold is an investment asset, and its value outpaces the dollar in the long run, despite the fact that for some periods of time, sometimes quite long, the dollar tries to take revenge on gold. The same can be said about other currencies - gold overtakes fiat money, and it is pointless to argue with this.
The relationship between gold and Treasury bond yields can also only be considered for short periods of time. However, the link between gold and inflation is, in my opinion, much more obvious. In an environment of low-interest rates and high inflation, Americans increasingly prefer gold as an investment. No wonder, along with the news that investors were withdrawing from American ETFs by selling "paper gold," the news came that they were actively buying gold investment coins.
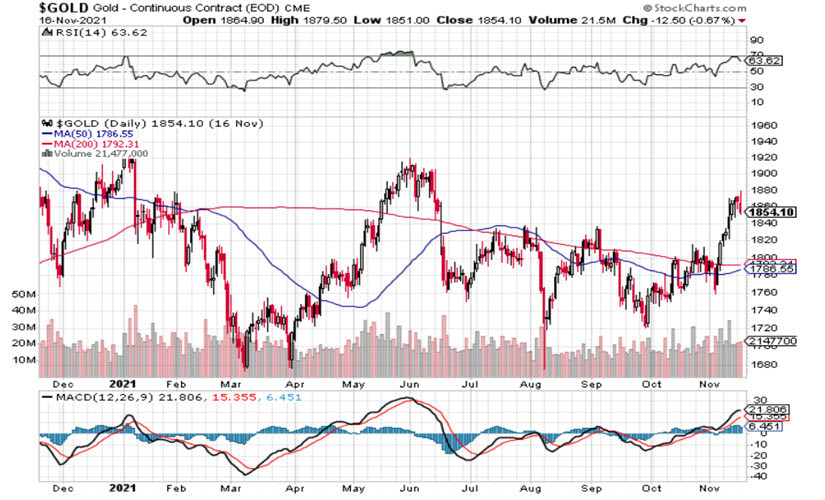
As you probably already know, last week, after the inflation data was released, gold surged rapidly and overcame the key resistance at 1,830, which opens up prospects for it with a first target at the level of August 2020 and subsequent growth by at least another 10%, that can happen in the future from one to six months. This follows from the technical picture and its parameters (Fig. 3).
For the sake of fairness, it should be noted that gold limits the level of 1,900 from above, however, it can be assumed that this level will soon fall, and here's why:

Fig. 3: Technical picture of gold
In trading and investing, there is a concept of true and false breakouts. There is no exception to the rule, but in general, an increase in trade volumes and an increase in the so-called Open Interest against the background of overcoming technical resistance indicate a "true" breakout, and vice versa, a price increase against the background of a lack of Open Interest growth often indicates that a breakdown can turn out to be false.
Let's compare the data kindly provided to us by the Commitment of Traders (COT) report with the technical picture, given the fact that OI is an indicator of supply and demand. Therefore, the higher the OI, the higher the demand, and vice versa.
As follows from this report, in June 2021, the OI indicator of gold futures traded on the COMEX-CME exchange amounted to 752,000 contracts, but against the background of the rise in the price of gold after the price reached the level of $1,870, demand began to decline sharply, and in 6 weeks, fell to the level of 608,000 contracts. At the same time, at the peak of the price, long positions of the main group of MoneyManager buyers amounted to about 167,000 contracts.
Now the situation looks completely different, the OI is growing sharply from the lows and over the past 4 weeks, it has grown from the level of 617,000 contracts to the level of 775,000, and MoneyManager has 190,000 contracts in long positions.
In fact, if we talk about the supply and demand of the futures market, now it is at the maximum values of 2021, and its growth against the background of the dollar growth and changes in the Federal Reserve policy suggests that that American speculators and investors are seriously considering gold as an asset prone to growth. This suggests that we can count on the resumption of the upward trend in gold, and we should not consider the possibility of a trend reversal from the level of $1,900 per troy ounce without good reason.
In conclusion, I would like to say a few words about other precious metals - platinum and silver. From a technical point of view, there are also prerequisites for the recovery of the upward trend, however, there is no reason to say that Open Interest has grown significantly in the futures market. This does not mean that these metals will not grow with gold, by no means, gold will raise the price for them like a locomotive.
However, the lack of demand for silver and platinum, in my opinion, means that in general the markets are not yet convinced that gold can continue to rise. Therefore, in any case, no matter how events develop, we should follow the rules of money management and consider the possibility that the negative scenario of the event is much closer than we might think.
The material has been provided by InstaForex Company - www.instaforex.com