Analysis of previous deals:
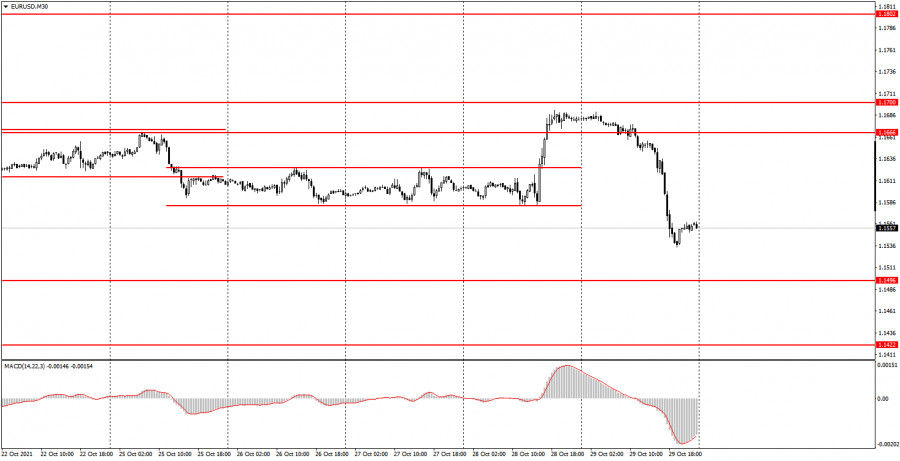
30M chart of the EUR/USD pair

The EUR/USD pair fell 150 points on Friday. And, frankly, it's even somehow difficult to comment on. Recall that in the last 3-4 months the pair has been trading at about 40-50 points a day, and I don't even remember the last time there was a volatility of more than 100 points. In addition, the results of the European Central Bank meeting were summed up on Thursday, and an absolutely disastrous report on US GDP in the third quarter was published. Thus, the fall of the dollar and the growth of the euro on Thursday were absolutely logical. But on Friday, statistics were published only in the European Union (important statistics) and again it turned out to be in favor of the euro. But instead of continuing to buy, the markets decided otherwise and started massive sales of the euro. And this is very difficult to explain. GDP in the eurozone in the third quarter was higher than forecast. Inflation accelerated in October to 4.1%, which, as in the case of the dollar, increases the likelihood of curtailing the stimulus program in the European Union. Thus, the euro should continue to rise. But no, instead we saw the biggest drop in the past few months. The technical picture at the 30-minute TF still does not suggest a trend movement. There is no trend line or trend channel now.
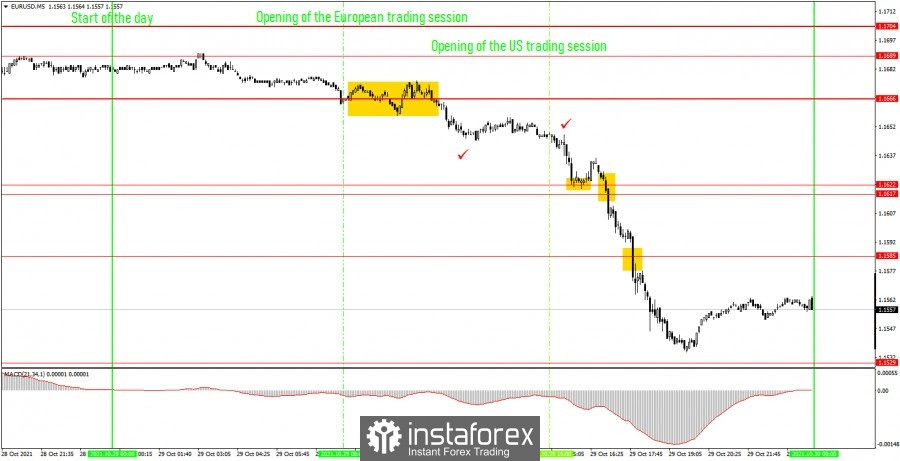
5M chart of the EUR/USD pair

Friday's downward movement on the 5 minute timeframe looks really impressive. But, unfortunately, the essence of the movement itself was not very good. Simply put, there was a strong and powerful movement, but there were no similar signals. Let's try to figure out the trading signals on Friday. The very first signal of the day crossed out the entire future movement of the EUR/USD pair. Simply because at the beginning of the European trading session the price danced around the level of 1.1666 for some time, consolidating itself above it and below it. Thus, only around this level, at least two false signals were formed, which could have brought a loss of about 22 points. However, the main problem is not this, but the fact that if novice traders rejected these signals, then the last sell signal near the same level of 1.1666 should not have been worked out, and it was it that turned out to be profitable! Moreover! The downward movement began, but during the publication of European statistics (the first tick), the pair, on the contrary, stopped moving !!! And when the price reached the next level of 1.1622, it first bounced off it, forming another false buy signal. Its novice traders also had to reject a long position, which turned out to be 25 points unprofitable !!! In general, by the middle of the working day, beginners already had 50 points of loss on the move that should have brought only profit. The signal to sell on consolidation below the level of 1.1617 should also be worked out by a short position. Subsequently, the price settled below the level of 1.1585 and went down about 70 points in total. According to Take Profit, this deal should not have been closed, since it was necessary to win back 50 points of loss. This could have been done by manually closing the deal in the late afternoon.
How to trade on Monday:
The pair traded actively on the 30-minute timeframe on Thursday, and very actively on Friday, only this did not affect the technical picture in any way. There is still no trend. Thus, it is still not very convenient to trade on the 30-minute TF, and we still do not recommend tracking signals from the MACD indicator. We advise you to wait for the formation of a trend line or trend channel. The key levels on the 5-minute timeframe for November 1 are 1.1496, 1.1529, 1.1585, 1.1617 - 1.1622. Take Profit, as before, is set at a distance of 30-40 points. Stop Loss - to breakeven when the price passes in the right direction by 15 points. At the 5M TF, the target can be the nearest level if it is not too close or too far away. If it is located - then you should act according to the situation or work according to Take Profit. On Monday, the only major report will be the ISM in the US manufacturing sector. But after the overly active last week, it's even difficult to imagine what to expect from the pair on Monday...
Basic rules of the trading system:
1) The signal strength is calculated by the time it took to form the signal (bounce or overcome the level). The less time it took, the stronger the signal.
2) If two or more deals were opened near a certain level based on false signals (which did not trigger Take Profit or the nearest target level), then all subsequent signals from this level should be ignored.
3) In a flat, any pair can form a lot of false signals or not form them at all. But in any case, at the first signs of a flat, it is better to stop trading.
4) Trade deals are opened in the time period between the beginning of the European session and until the middle of the American one, when all deals must be closed manually.
5) On the 30-minute TF, using signals from the MACD indicator, you can trade only if there is good volatility and a trend, which is confirmed by a trend line or a trend channel.
6) If two levels are located too close to each other (from 5 to 15 points), then they should be considered as an area of support or resistance.
On the chart:
Support and Resistance Levels are the Levels that serve as targets when buying or selling the pair. You can place Take Profit near these levels.
Red lines are the channels or trend lines that display the current trend and show in which direction it is better to trade now.
The MACD indicator (14,22,3) consists of a histogram and a signal line. When they cross, this is a signal to enter the market. It is recommended to use this indicator in combination with trend lines (channels and trend lines).
Important speeches and reports (always contained in the news calendar) can greatly influence the movement of a currency pair. Therefore, during their exit, it is recommended to trade as carefully as possible or exit the market in order to avoid a sharp price reversal against the previous movement.
Beginners on Forex should remember that not every single trade has to be profitable. The development of a clear strategy and money management are the key to success in trading over a long period of time.
The material has been provided by InstaForex Company - www.instaforex.com