Analysis of Tuesday trades
EUR/USD on M30

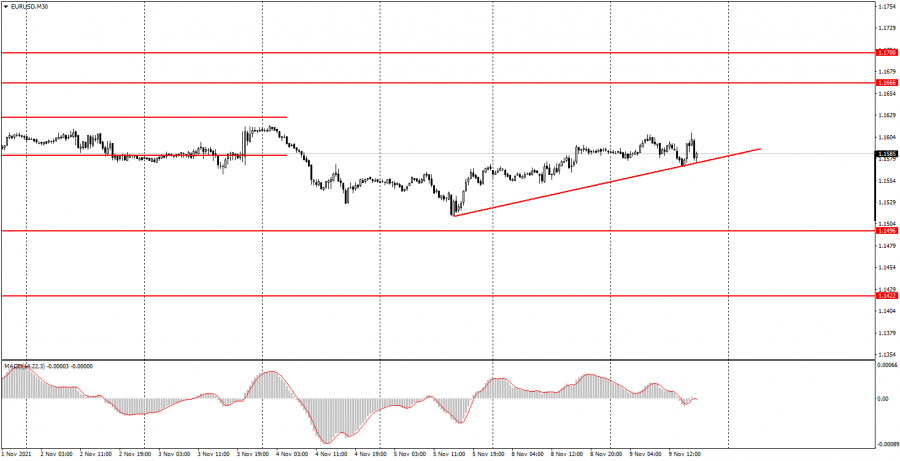
On Tuesday, EUR/USD continued its uptrend and even formed an ascending line. However, we would like to pay your attention to the volatility of the pair. For example, today the volatility range was 40 pips while yesterday it was 44 pips. Thus, the volatility rate is very weak at this time. The same goes for the ascending line which is of a purely formal nature. The price can settle below this line at any moment. The entire range of the price movement between the high and the low of the trend is found within just 95 pips, which took the pair 3 days to overcome. Thus, if the price makes a clear rebound from this trendline, we can consider buying the pair on a 30-minute time frame. But you should be very careful here, otherwise, you'd better give up this idea. I would say that the technical picture on this time frame remains extremely unfavorable for traders as it is the most difficult scenario to trade with. No macroeconomic reports were released on Tuesday in both the United States and the EU. The speeches by Christine Lagarde and Jerome Powell did not give any clues to the markets and, therefore, did not prompt any repose from them.
EUR/USD on M5

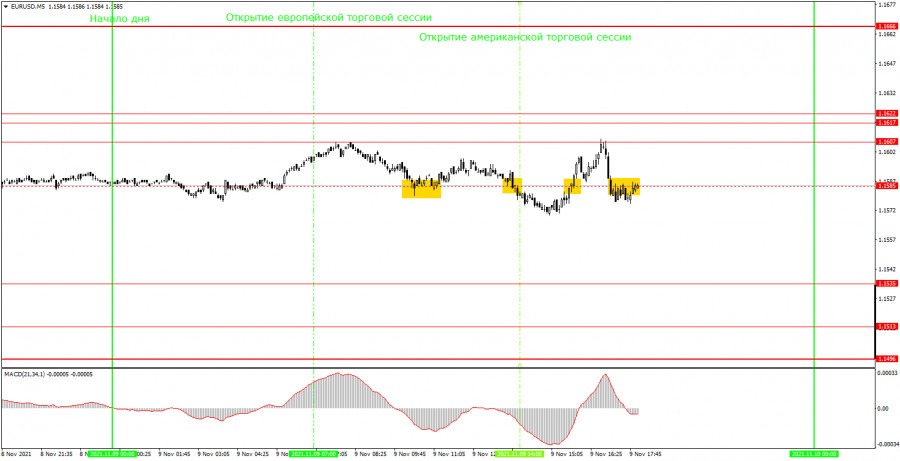
On the 5-minute time frame, the pair's trajectory was very uneven on Tuesday. As you can see in the illustration above, the price has crossed the level of 1.1585 several times but this level has lost its relevance by the end of the day. When the price repeatedly crosses the same level, this is the first sign of an upcoming flat movement. Actually, this is what we were observing for the whole day. At the moment, the flat movement is clearly distinguished, but during the European session, it was not so obvious. Thus, traders should have tried to use the first two signals near the level of 1.1585. Yet, these signals eventually brought losses to beginners. The first buy trade closed with a loss of 11 pips. The second sell trade brought 10 pips of losses. Both times the price moved in the right direction by only 10 pips, which was not enough even to set Stop Loss to a breakeven point. The last two trading signals also turned out to be false. Novice traders should not have followed them as two false signals had already been formed near the level of 1.1585 by that time.
Trading tips for Wednesday
An ascending trend line has been formed on the 30-minute time frame at this time. If it stays in place until tomorrow, then you can trade long after the price rebounds from this level. However, it is more likely that the price will consolidate below this trend line as soon as today. On a 5-minute time frame, the key levels for November 10 are found at 1.1535, 1.1607, 1.1617, and 1.1622. As usual, Take Profit should be set at the distance of 30-40 pips. Stop Loss should be placed to a breakeven point as soon as the price passes 15 pips in the right direction. On M5, the nearest level could serve as a target unless it is located too close or too far away. If it is, then you should act according to the situation or trade with the Take Profit. On Wednesday, we would advise beginners to focus on the US inflation report which will be released in the afternoon. Despite the fact that the pair has been holding in the sideways channel for more than a month (as can be clearly seen on higher time frames), the reaction to this report can be very strong.
Basic rules of the trading system:
1) The signal strength is determined by the time it took to form the signal (a bounce or a breakout of the level). The quicker it formed, the stronger the signal is.
2) If two or more positions were opened near a certain level based on false signals (which did not trigger Take Profit or reach the nearest target level), then all subsequent signals from this level should be ignored.
3) In a sideways channel, a pair can form multiple false signals or not form them at all. But in any case, at the first sign of a flat movement, it is better to stop trading.
4) Trades should be opened in the period between the start of the European session and the middle of the US trading hours when all positions must be closed manually.
5) You can trade using signals from the MACD indicator on the 30-minute time frame only given that volatility is good and there is a clear trend that should be confirmed by a trendline or a trend channel.
6) If two levels are located too close to each other (from 5 to 15 pips), they should be considered support and resistance levels.
On the chart
Support and Resistance Levels are the levels that serve as targets when buying or selling the pair. You can place Take Profit near these levels.
Red lines are channels or trendlines that display the current trend and show in which direction it is better to trade now.
The MACD indicator (14, 22, and 3) consists of a histogram and a signal line. When they cross, this is a signal to enter the market. It is recommended to use this indicator in combination with trend patterns (channels and trendlines).
Important announcements and economic reports that you can always find on the economic calendar can seriously influence the trajectory of a currency pair. Therefore, at the time of their release, we recommend trading as carefully as possible or exiting the market in order to avoid sharp price fluctuations.
Beginners on Forex should remember that not every single trade has to be profitable. The development of a clear strategy and money management is the key to success in trading over a long period of time.
The material has been provided by InstaForex Company - www.instaforex.com