Analyzing Thursday trades
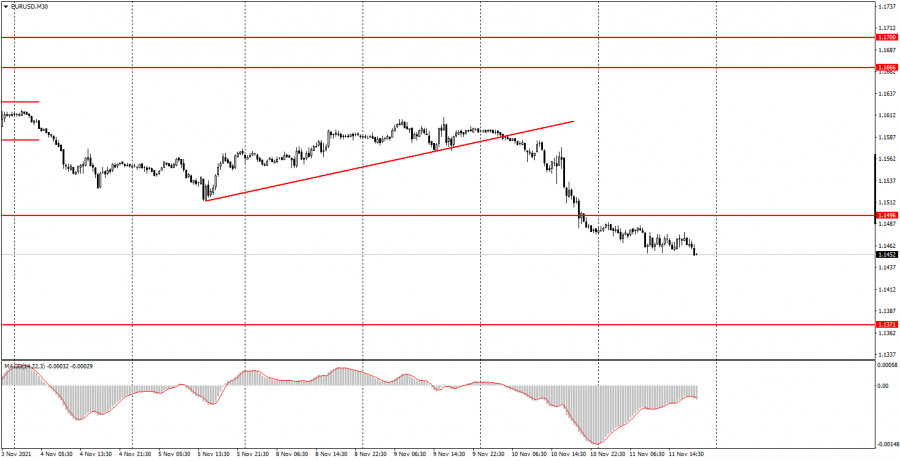
EUR/USD on M30 chart

On Thursday, the EUR/USD pair was trading as usual, with daily volatility of just over 30 pips. Besides, a full-fledged flat movement was observed throughout the day. In the evening, the bearish pressure on the pair resumed, resulting in a slight decline or, rather, the continuation of the downward movement. Formally, the pair is moving downwards at the moment after breaking through the ascending line. However, this trend does not even have two pivot points to form its own trendline. Thus, the trend is very difficult to trade with, especially for beginners who usually work with the most simple analysis tools. Anyway, the US dollar continues to strengthen after yesterday's report on US inflation which rose to 6.2% on a yearly basis. Today, no important fundamental news or economic releases have been published either in the US or the EU. This partly explains such weak volatility.
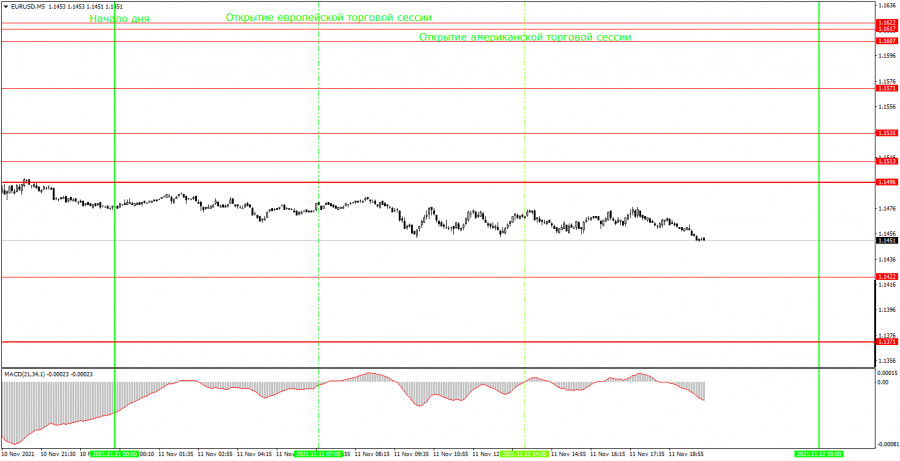
EUR/USD on M5 chart

On the 5-minute time frame, there was hardly any movement on Thursday. Although the market stabilized later in the afternoon, there was a clear sideways movement most of the day with minimum volatility of less than 30 pips. Moreover, the price did not even approach the levels at which a trading signal could have been formed. This is partly because few levels can be seen near these price values. The price has not been at such low levels for more than 10 months. So, the illustration depicts mostly strong levels but almost does not show the weak ones which in most cases represent the lows and highs of the day. The quotes also failed to reach the nearest level of 1.1422. So, today turned out to be an unplanned day off for traders.
Trading tips on Friday
On the 30-minute time frame, the pair continues to move down although the MACD indicator is pointing upwards. This is another disadvantage of such a movement that we have observed lately. In other words, the movement is so weak that the MACD indicator does not react to it. Today, quotes have passed a little more than 30 pips. This is a very small distance even for the euro/dollar pair. However, the movement may continue with the target of 1.1371. On the 5-minute time frame, the key levels for November 12 are located at 1.1371, 1.1422, 1.1496, 1.1513, and 1.1535. Take Profit should be set at a distance of 30-40 points. Stop Loss should be placed to a breakeven point as soon as the price passes 15 pips in the right direction. . On the M5 chart, the nearest level could serve as a target unless it is located too close or too far away. If it is, then you should act according to the situation or trade with a Take Profit. On Friday, beginners will again have nothing to pay their attention to, since neither the US nor the EU will publish any important macroeconomic reports. In theory, the consumer sentiment index from the University of Michigan can affect the market sentiment, but the likelihood is low.
Basic rules of trading
1) The signal strength is determined by the time the signal took to form (a bounce or a breakout of the level). The quicker it is formed, the stronger the signal is.
2) If two or more positions were opened near a certain level based on false signals (which did not trigger a Take Profit or test the nearest target level), then all subsequent signals at this level should be ignored.
3) When trading flat, a pair can form multiple false signals or not form them at all. In any case, it is better to stop trading at the first sign of a flat movement.
4) Trades should be opened in the period between the start of the European session and the middle of the US trading hours when all positions must be closed manually.
5) You can trade using signals from the MACD indicator on the 30-minute time frame only given that volatility is strong and there is a clear trend that should be confirmed by a trend line or a trend channel.
6) If two levels are located too close to each other (from 5 to 15 pips), they should be considered support and resistance levels.
On the chart
Support and Resistance Levels are the levels that serve as targets when buying or selling the pair. You can place Take Profit near these levels.
Red lines are channels or trend lines that display the current trend and show in which direction it is better to trade now.
The MACD indicator (14, 22, and 3) consists of a histogram and a signal line. When they cross, this is a signal to enter the market. It is recommended to use this indicator in combination with trend patterns (channels and trend lines).
Important announcements and economic reports that you can always find on the economic calendar can seriously influence the trajectory of a currency pair. Therefore, at the time of their release, we recommend trading as carefully as possible or exiting the market in order to avoid sharp price fluctuations.
Beginners on Forex should remember that not every single trade has to be profitable. The development of a clear strategy and money management is the key to success in trading over a long period of time.
The material has been provided by InstaForex Company - www.instaforex.com