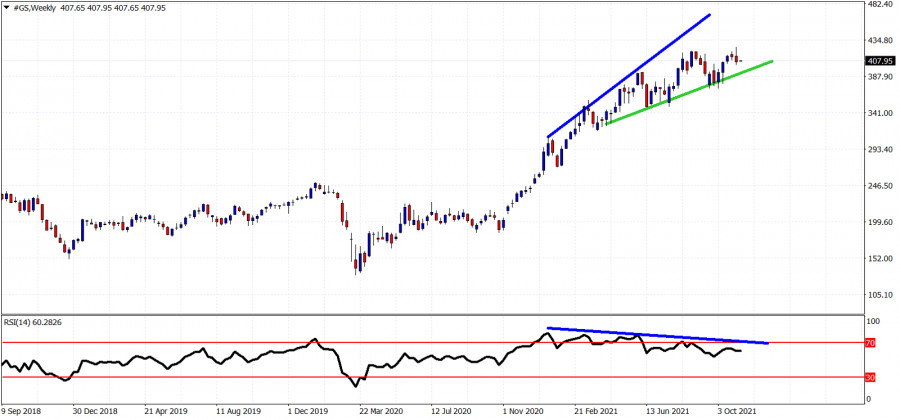
GS stock price has been in a bullish trend since March of 2020. Price is making higher highs and higher lows since then, however over the last few months we observe a warning signal in the weekly chart.

Blue lines- bearish RSI divergence
Despite making higher highs, the RSI is making lower highs, suggesting that the weekly trend is weakening. This is an important warning signal and if combined with a technical reversal, we could see a major pull back occur. Last week price made a new higher high but the weekly close was at the lowest of last week's range. It is important for bulls to defend the green upward sloping support trend line. Breaking below it will be another sign of weakness. Confirmation of a trend reversal will come if and when price breaks below $372.
The material has been provided by InstaForex Company - www.instaforex.com