Bitcoin has made a difficult journey from a speculative cryptocurrency with great potential to an institutionally attractive asset class in the last six months. As this process progressed, interest in the coin grew among large companies and gradually declined among retail traders. Thanks to this, Bitcoin has become a more stable and predictable tool, as well as an important mechanism in the fight against the protection of funds from inflation. All these factors caused the growth of quotes of the first cryptocurrency to $66k, where the last maximum was set. And even despite the fundamental nature of the growth, JPMorgan experts believe that the price of the currency is overestimated by two times.
The analytical department of the investment bank conducted a study comparing the volatility levels of gold and Bitcoin. According to the data obtained, the level of volatility of Bitcoin is four times higher than that of gold. Given this, analysts concluded that the real value of the first digital asset should be at $35k. At the same time, it should be borne in mind that if volatility decreases by half, then the fair price for the cryptocurrency will rise to $73k. Despite a significant leap in development, the volatility of BTC still remains at too high a level as a class asset.
According to JPMorgan representatives, the current value target of $100k is unlikely to be achieved at the current level of volatility. In conclusion, experts said that the entire digital asset sector is an extremely promising industry that is in a bullish trend. At the same time, considering cryptocurrencies as a key asset is too risky due to increased instability.
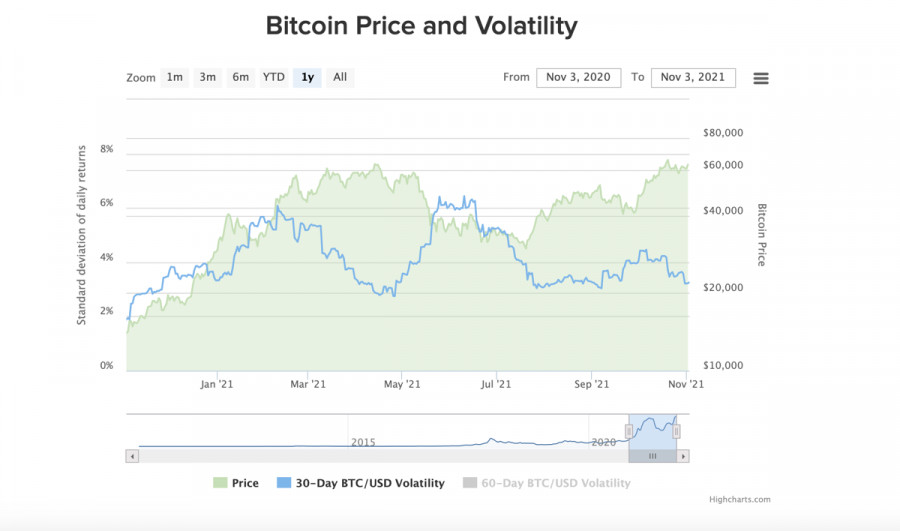
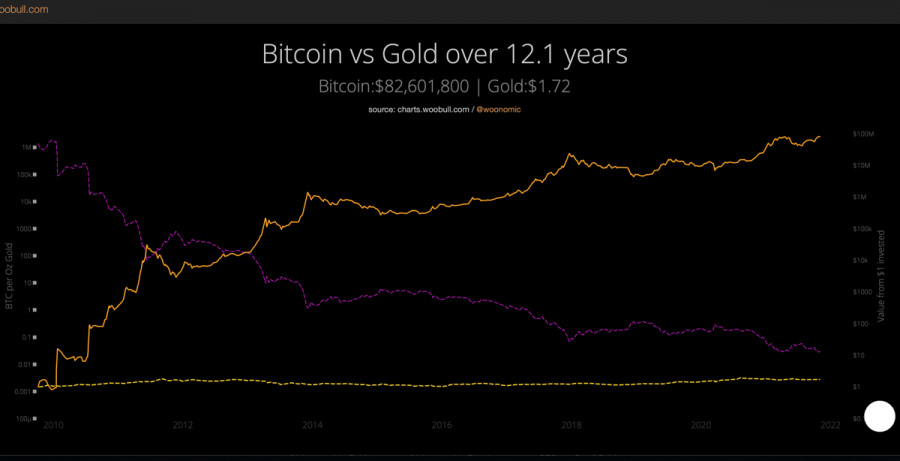
Volatility remains the only fundamental problem of Bitcoin and the main advantage of gold at the current stage of the development of financial instruments. It is unlikely that such conclusions can scare investors away from using Bitcoin, but the riskiness of a digital asset still affects the degree of its acceptance as a means of payment at different levels.
Over the past six months, the main catalyst for the growth of BTC has been the fear of inflation, and not the versatility of the ecosystem or investment attractiveness. Moreover, experts believe that in order to maintain its current position in the market as a whole, Bitcoin needs to expand its interaction with the DeFi and NFT markets, which mostly belong to ETH.
The first bell to aggravate the competition between the two assets is a study stating that the growth of ether has significantly outpaced the pace of Bitcoin. And the NFT and decentralized finance markets played an important role in this.
In addition, it is worth noting that even the growth of institutionalization and the adoption of Bitcoin as a class asset are not able to quickly change the situation with volatility. At the same time, there is a positive dynamics of a decrease in the volatility of Bitcoin and an increase in the gold index. Taking into account this fact and other advantages of the first crypto asset, BTC is a more attractive means of hedging risks.
This is confirmed by the data of cryptocurrency exchanges, where there was another surge in the activity of major players confidently purchasing BTC. Over the past week, the balances of addresses where at least 1000 BTC is located have been replenished with another 142k bitcoin coins. This indicates the imminent start of a bullish rally, which will become the main dish within the current upward trend. As of 12:00 UTC, the asset is trading near $62.5k with daily trading volumes in the region of $34 billion.
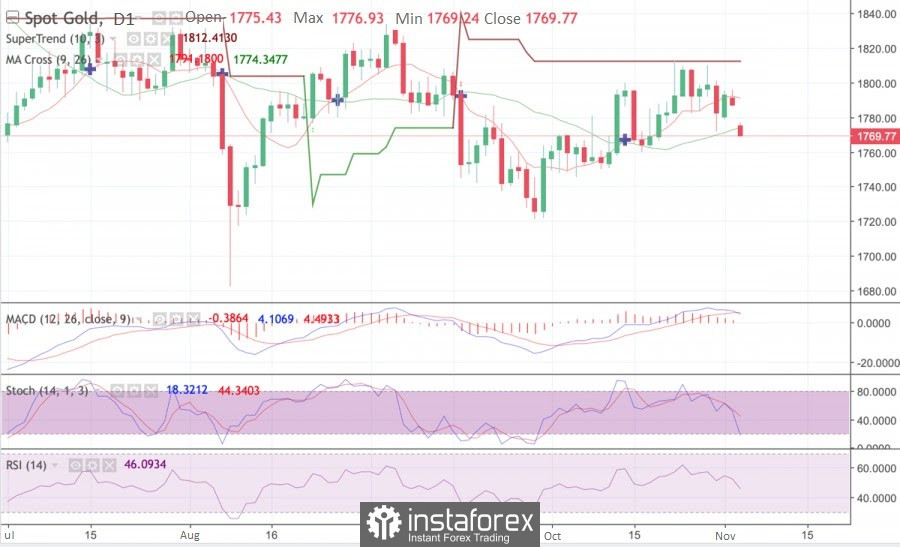
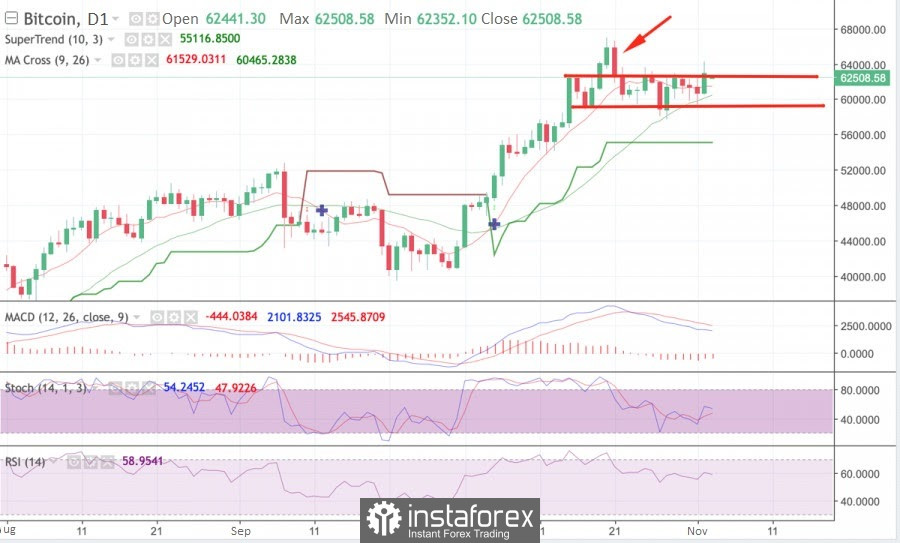
On the daily chart, Bitcoin formed a confident bullish candle but was pushed under the resistance zone at $63,060. At the same time, the asset is coming to the end of the consolidation phase, and it is likely that at the end of the current trading day it will try to break through the resistance line. This is indicated by the uncertainty of sellers during October 30, 31, and November 1, after which the bulls formed a powerful bullish candle, signaling the beginning of a new stage of growth.
The last time the price broke through the resistance line was during the update of the historical maximum, and therefore, with its successful breakdown, the quotes will move to the $64.2k mark, after which the movement will follow to a new maximum.
At the same time, BTC/USD technical indicators show signs of weakness: the MACD has leveled off but is moving in an uncertain flat, and stochastic has sharply started moving parallel to the price, which indicates a lack of support for the medium-term momentum. The relative strength index also began to decline, which indicates the weakness of buyers and the loss of bullish momentum.
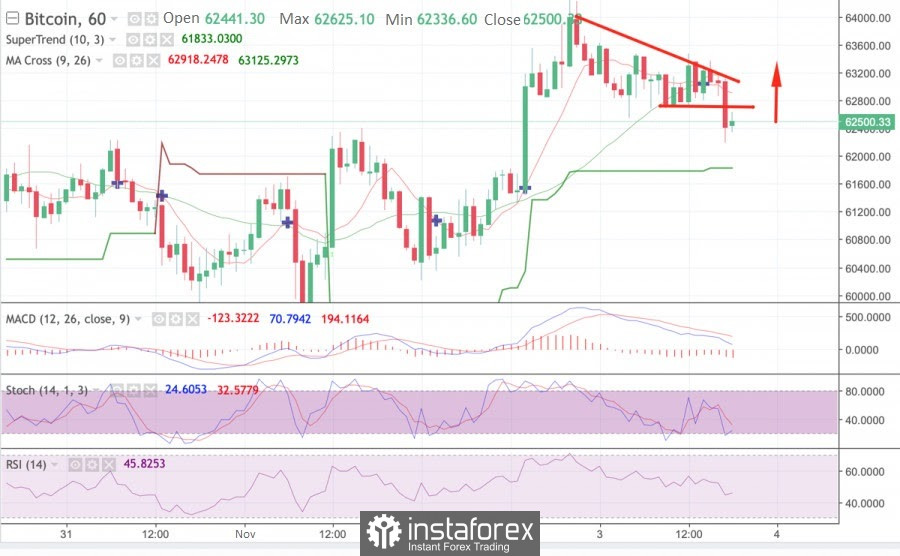
The hourly chart confirms the prerequisites for a local reversal and retest of the resistance zone, but for this, it is necessary to recover above the breakdown zone of the "bearish triangle" technical analysis figure at $62,770. The formation of a long red candle with a long lower wick indicates that the price is being pushed out of current positions, which confirms the activation of buyers and the greater strength of the short-term trend.
This is also confirmed by technical indicators: the stochastic oscillator and the relative strength index began to recover after falling to local lows, but at the same time, the MACD continues to fluctuate, which indicates that the bears are still strong. The fate of the medium-term trend will be decided when the hourly chart is fixed above the bearish formation. So far, everything points to fluctuations within the local support and resistance zones.
