4-hour timeframe

Technical details:
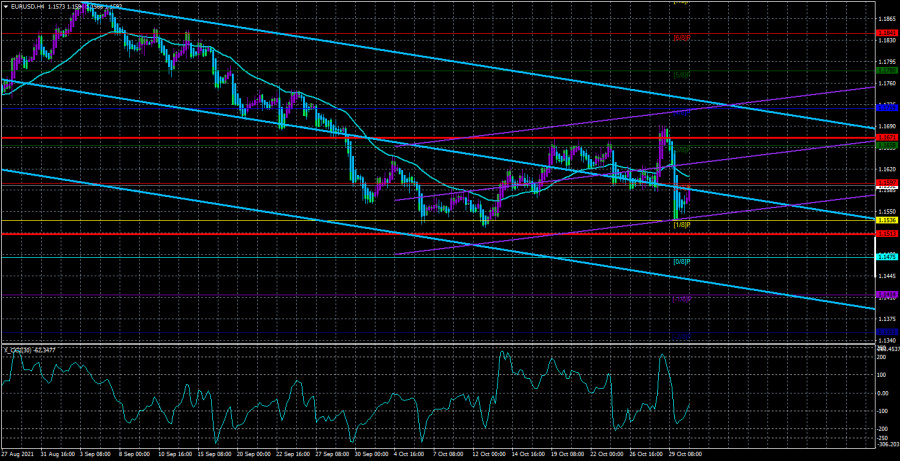
Higher linear regression channel: direction - downward.
Lower linear regression channel: direction - upward.
Moving average (20; smoothed) - downward.
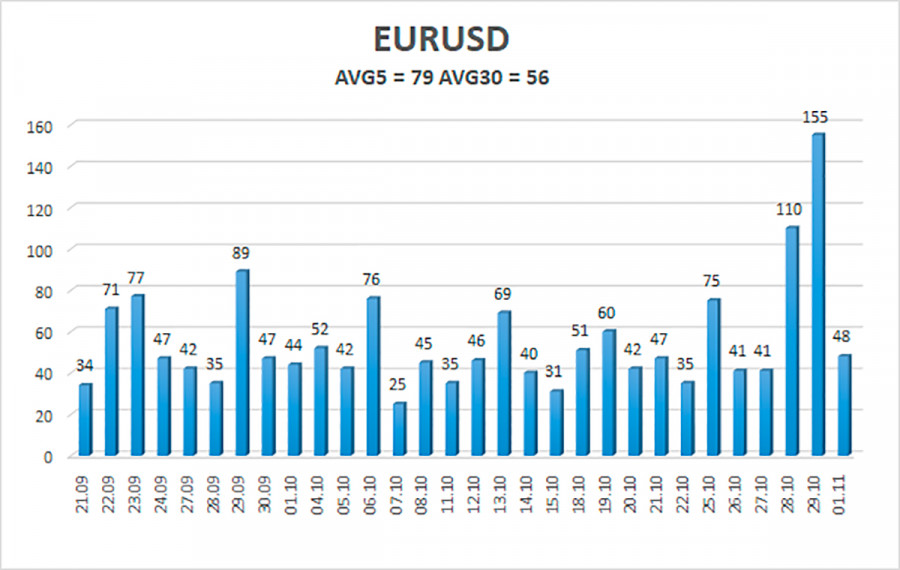
The EUR/USD currency pair on Monday traded much less volatile than on Friday. After the quotes of the euro collapsed by 155 points, breaking the 4-month volatility record, it was difficult to expect that on Monday, with an almost empty calendar of macroeconomic events, the pair would show approximately the same volatility. As we have already said, the movement and its strength on Friday are still very difficult to explain. As usual, there are a huge number of options and hypotheses. The first thing to pay attention to was the strong growth of the dollar. Recall that to one degree or another, the growth of the US dollar remains in the euro/dollar and pound/dollar pairs in 2021. Yes, against the pound, the dollar is growing frankly reluctantly, and against the euro - more fun and lively. Nevertheless, the US currency is strengthening mainly this year. At first, it was a simple correction against an upward global trend. But this correction has already taken too long. And in recent months, the reasons why the dollar could grow have already had to be searched out. One of these reasons may be the upcoming Fed meeting. Recall that for several months now, the markets have been waiting for the curtailment of the quantitative stimulus program. And the quantitative stimulus program may be one of the main reasons for the fall of the dollar in 2020. Thus, it would be logical to assume that as soon as it begins to collapse, the US currency will immediately begin to receive additional reasons for growth. We can assume that now the US dollar is growing "upfront", and the markets believe that the QE program will begin to wind down in 2021.
"A double-edged sword."
Unfortunately, such conclusions are a double-edged sword. On the one hand, it seems obvious that the dollar will start to rise in price if the Fed announces the end of QE and its readiness to tighten monetary policy. On the other hand, in reality, we can see an opposite reaction of the market to this decision of the regulator. A vivid example of this is the end of last week. On Thursday, the reaction of the markets to the US GDP report and the ECB meeting was logical. However, on Friday, it was illogical. Moreover, Friday's illogical movement completely crossed out the entire movement of Thursday, and the European statistics were simply ignored, although they also had the status of important. Thus, if it seems to you that something will happen with a high probability, then most likely it will not happen at all. It's best to just clearly understand what options are possible and be prepared for each. On Wednesday, the Fed can easily postpone the adoption of the most important decision to the last meeting of this year.
It is noteworthy that many respected banks, analysts, and experts continue to bet on the tightening of the Fed's monetary policy in the near future. Many are waiting for a rate hike next year. Many expect further growth of the dollar index. For example, Goldman Sachs bank expects the first rate hike in July 2022. And this is although, in November 2021, the $120 billion-a-month QE program is still in effect. Recall that the rate cannot be raised until the QE incentive program is fully completed. Goldman Sachs also explained why they are waiting for a rate hike so early: "The main reason for the change in our rate forecast is that we now expect core inflation to remain above 3% and the consumer price index to remain above 4% when the curtailment of incentives is completed." Now, the bank does not expect a strong decrease in inflation until the rate starts to rise. In general, there is a lot of talk about inflation and the QE program, and there is no point in guessing what decision the Fed will make. And it is even more impossible to predict what reaction the market will show this Wednesday.

The volatility of the euro/dollar currency pair as of November 2 is 79 points and is characterized as "average". Thus, we expect the pair to move today between the levels of 1.1513 and 1.1671. The reversal of the Heiken Ashi indicator back down will signal the resumption of the downward movement.
Nearest support levels:
S1 – 1.1536
S2 – 1.1475
S3 – 1.1414
Nearest resistance levels:
R1 – 1.1597
R2 – 1.1658
R3 – 1.1719
Trading recommendations:
The EUR/USD pair has consolidated below the moving average line, so the trend has changed to a downward one. Thus, today, we should consider new short positions with targets of 1.1536 and 1.1513 after the reversal of the Heiken Ashi indicator down. Purchases of the pair should be considered if the price is fixed back above the moving average with targets of 1.1658 and 1.1671 and keep these trades open until the Heiken Ashi indicator turns down.
Explanations to the illustrations:
Linear regression channels - help determine the current trend. If both are directed in the same direction, then the trend is strong now.
Moving average line (settings 20.0, smoothed) - determines the short-term trend and the direction in which to trade now.
Murray levels - target levels for movements and corrections.
Volatility levels (red lines) - the likely price channel in which the pair will spend the next day, based on current volatility indicators.
CCI indicator - its entry into the oversold area (below -250) or into the overbought area (above +250) means that a trend reversal in the opposite direction is approaching.
The material has been provided by InstaForex Company - www.instaforex.com