EUR/USD 24-hour TF analysis.

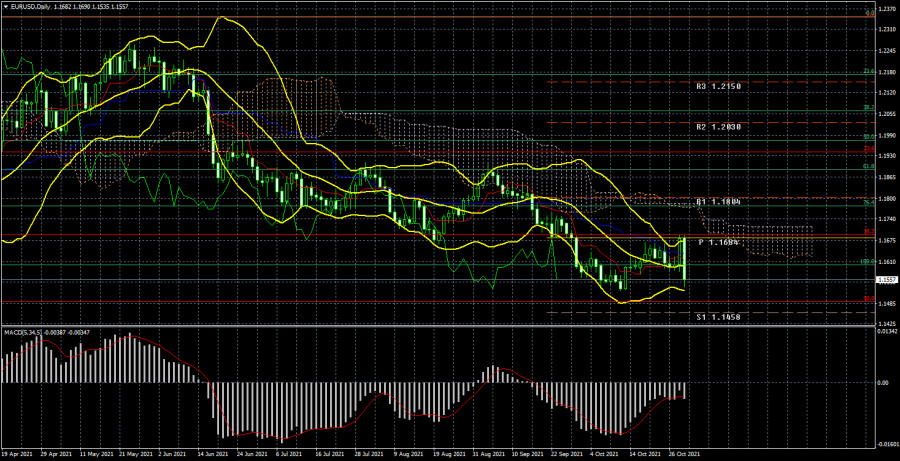
The EUR/USD currency pair continued to adjust against the short-term downward trend during the current week as a whole. If not for the last trading day of the week – Friday, when the pair collapsed down by 140 points, which it has not been for a very long time. And this is although a day earlier, on Thursday, the quotes of the European currency rose by 100 points after the ECB meeting and the US GDP report. What happens? On Thursday, when the "foundation" and "macroeconomics" were strong, the pair passed 100 points, and on Friday, when the "macroeconomics" was weaker, but still, in favor of the euro, the pair fell by 140 points. Illogical behavior of the market. Let's talk about the macroeconomic background a little lower. However, for now, I would like to note the abnormally strong volatility of the euro/dollar pair at the end of this week. Recall that the volatility does not exceed 40-50 points per day for three or four months. Thus, the fall on Friday raises questions. The technical picture could also confuse traders. On Thursday, the quotes were fixed above the critical Kijun-sen line on the 24-hour TF, which allowed us to expect the continuation of the upward movement. However, instead, a collapse followed, after which the pair again found itself under the critical line. In general, this is the case when the "foundation" and "macroeconomics" influenced the "technique" in the wrong way and only confused it. Now the downward trend is formally maintained. However, the Bollinger bands are now directed sideways, which indicates a possible flat. The price may continue to strive for the Fibonacci level of 1.1490 (50.0%), from the entire upward trend segment, which has been forming for a year and a half.
Analysis of the COT report.

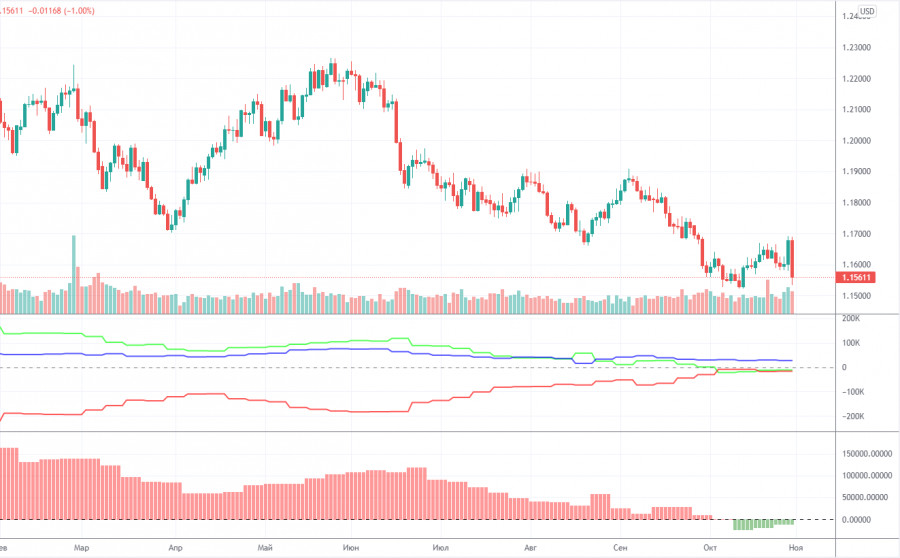
During the last reporting week (October 19-25), the mood of non-commercial traders has not changed much. During the reporting week, a group of "Non-commercial" traders opened 4 thousand contracts for sale and 4 thousand contracts for purchase. Consequently, the net position of professional players has not changed. And if so, then the mood of the big traders remained "bearish." Yes, it is "bearish", as evidenced by both indicators in the illustration above. The green and red lines of the first (net positions of non-commercial and commercial players) continue to move towards each other, which still means that the upward trend is ending. Or the downward correction is delayed. Recall that the process of convergence of these lines began at the beginning of the year when the upward movement stopped. At the moment, this whole process does not even fit into the illustration – the downward movement continues for so long, which we still consider a correction. The most interesting thing is that the last two trading days of this week were not included in the latest COT report. We do not know how the major players traded on Thursday and Friday when the pair passed about 250 points. It should also be noted that the net position of non-commercial traders remains below zero. The number of short positions exceeds the total number of long positions. Therefore, based on the COT reports, the fall of the European currency may continue. The nearest target, as we have already said, is the important level of 1.1490. So far, COT reports do not allow us to conclude a change in the trend.
Analysis of fundamental events.
There were quite a lot of macroeconomic and fundamental events this week. However, all the most interesting things that happened last week were almost empty. On Thursday, the ECB summed up the results of its two-day meeting, and they were "moderately hawkish". However, in general, the meeting can simply be considered "passing", because the most important was Christine Lagarde's statement about the slowdown in asset purchases in the fourth quarter. The US GDP report also had a strong impact on the pair, which turned out to be much weaker than forecasts and disappointed traders. However, how to explain Friday's collapse of the euro currency? On this day, the European Union released a report on inflation, which accelerated to 4.1%, as well as a report on GDP, which turned out to be better than forecasts. However, the euro began to fall at night, continued it at the European trading session. It did not react to it during the release of European statistics. Moreover, at the American session, it collapsed "like a stone". The European statistics on Friday were ignored, and the markets admitted that they were wrong on Thursday. Or have they shown that they are not at all interested in buying European currency now?
Trading plan for the week of November 1-5:
1) On the 24-hour timeframe, the upward trend has not changed, since the bulls were saved near the first serious 38.2% Fibonacci level of 1.1691. At the moment, the quotes have gone below the Kijun-sen line, and the markets have shown that they are not ready to buy the pair. Thus, the downward movement may continue with the target of 1.1490. The main thing is that now the volatility remains high for as long as possible.
2) As for purchases of the euro/dollar pair, in the current conditions, they should be considered no earlier than fixing the price above the critical line. Ideally, above the Ichimoku cloud, because the price has already overcome the Kijun-sen several times, but then could not continue to move up. And the last such time was just this week. There are few prerequisites for a new upward trend to begin in the near future, although the general fundamental background still indicates a very likely fall in the dollar.
Explanations to the illustrations:
Price levels of support and resistance (resistance /support), Fibonacci levels - target levels when opening purchases or sales. Take Profit levels can be placed near them.
Ichimoku indicators (standard settings), Bollinger Bands(standard settings), MACD(5, 34, 5).
Indicator 1 on the COT charts - the net position size of each category of traders.
Indicator 2 on the COT charts - the net position size for the "Non-commercial" group.
The material has been provided by InstaForex Company - www.instaforex.com