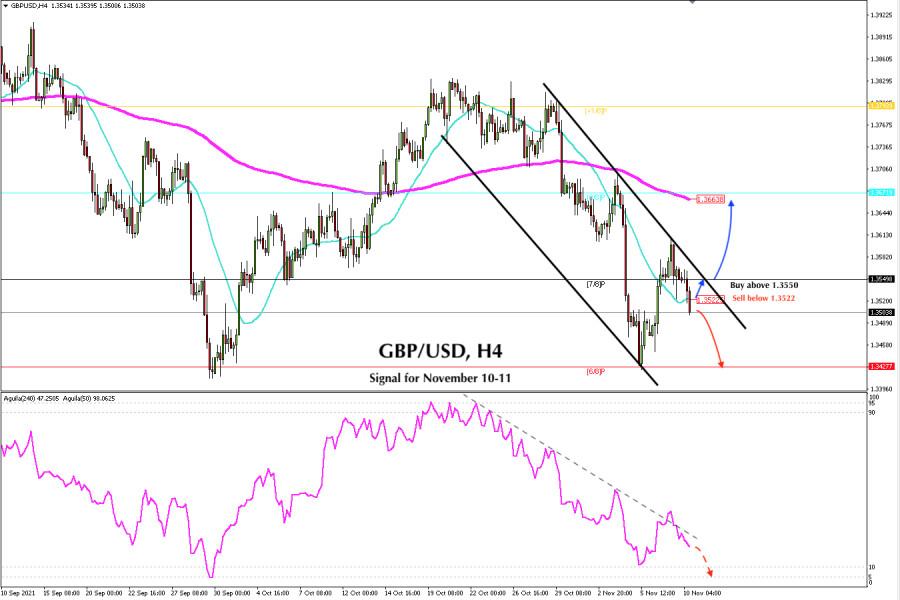
The British Pound has been trading below the downtrend channel formed since October 28. Before the US inflation data, GBP/USD is trading at 1.3503 below the SMA of 21 and showing a bearish signal.
As long as the price remains below 7/8 of murray and below the SMA of 21 (1.3522), the pair could continue its bearish path and could reach 6/8 of murray around 1.3427.
In the next few hours, the US inflation data will be published and this could give strong volatility to the GBP / USD pair. So, we could see a downward movement if the data is at least in line with expectations.
A sharp break above 1.3550 could be the start of a new bullish scenario and GBP/USD could rise quickly towards the 200 EMA located at 1.3663.
The eagle indicator continues to move below a downtrend line. The signal for today is negative and we could see an acceleration of the GBP fall to the levels of 10 or 5 points, which would be reflected in the price in the area of 1.3427, approximately.

The market sentiment report shows that there are 63.24% of traders who are buying the GBP / USD pair. This is a bearish sign for the British pound. GBP/USD could continue its downward movement in the coming days. If the pair closes through 1.3427, the price could fall to the 200 EMA located at 1.3290 on the daily chart.
Our trading plan in the next few hours is to sell below the SMA of 21 located at 1.3522 with targets towards 1.3427. The eagle indicator supports our bearish strategy.
Below we leave the support and resistance levels for the next two days.
Support and Resistance Levels for November 10 - 11, 2021
Resistance (3) 1.3543
Resistance (2) 1.3596
Resistance (1) 1.3536
----------------------------
Support (1) 1.3476
Support (2) 1.3429
Support (3) 1.3375
***********************************************************
A trading tip for GBP/USD for November 10 - 11, 2021
Sell below 1.3522 (SMA 21) with take profit at 1.3476 and 1.3427 (6/8), stop loss above 1.3553.
The material has been provided by InstaForex Company - www.instaforex.com