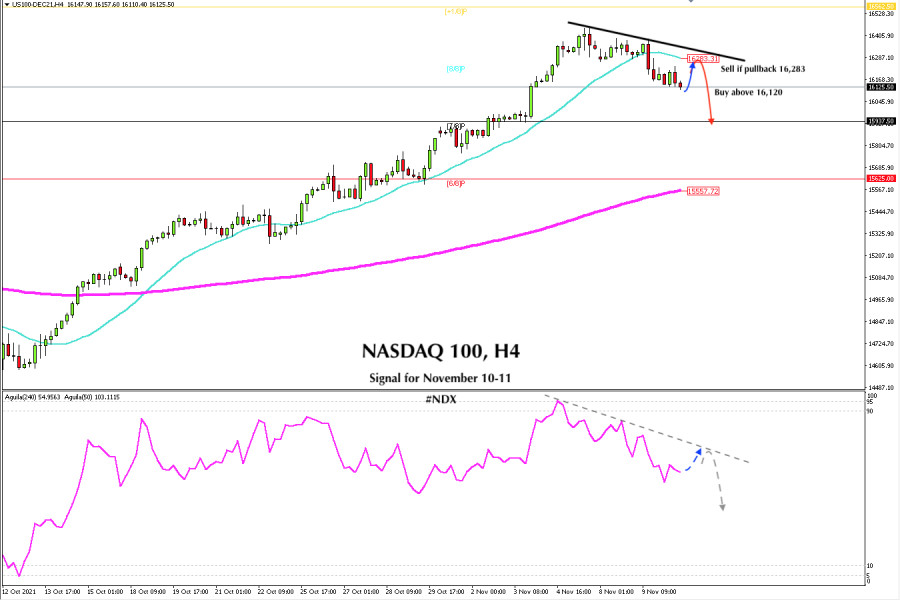
Nasdaq 100 (#NDX) is trading below the 21 SMA. The last time it consolidated below this moving average was on October 13. Given that, it is now situated below 16,283. This could be a negative sign and the index could drop to the 7/8 murray support around 15,937.
On November 4, the eagle indicator touched the 95-point level, that was the key bearish reversal signal. Since then, the Nasdaq began a decline that could drag the price down to 15,625 in the next few days where the EMA 200 is located.
The eagle indicator is fluctuating within a downtrend channel. A recovery of the Nasdaq 100 is likely in the coming hours. In case if US inflation moderated in October, Nasdaq could retest the strength of the SMA of 21.
A pullback towards the level of 16,283 will be an opportunity to sell with targets at 15,937 where there is the 7/8 of murray. If this support is broken, the index could continue its downward movement to the EMA of 200 located at 15,557 around 6/8 murray.

Below we leave the support and resistance levels for the next two days.
Support and Resistance Levels for November 10 - 11, 2021
Resistance (3) 16,345
Resistance (2) 16,250
Resistance (1) 16,195
----------------------------
Support (1) 16,088
Support (2) 16,024
Support (3) 15,937
***********************************************************
A trading tip for NASDAQ 100 for November 10 - 11, 2021
Buy above 16,120 with take profit at 16,283 (SMA 21), stop loss below 16,070.
The material has been provided by InstaForex Company - www.instaforex.com