Bitcoin managed to update its historical maximum and survive a light correction by end of November, which is incomparable with any other for the period of 2020-2021. Although November closed with an uncertain red candle, the situation cannot be called bearish. The coin has undergone an important period of stabilization and liquidity collection since the ATH update. In addition, there are still several interesting formations on the charts that promise great gifts for the New Year tree for all participants in the cryptocurrency market.
However, first I will summarize the small results of November for bitcoin. This rundown is necessary in order to summarize what happened to the first cryptocurrency in November and what to expect from it in December.
On November 10, Bitcoin updates its all-time high at $69k, after which it undergoes several waves of impulse correction, provoked and aggravated by the news agenda. At the same time, throughout November, the technical indicators of the cryptocurrency most likely indicated a period of consolidation and "tug-of-war," therefore, we did not see broad impulse movements (except for those provoked by fundamental factors). As a result, the bears managed to get a slight advantage, thanks to which the price closed $4.5k lower than it opened.
It is worth noting here that a significant contribution to this was made by the chairman of the Fed, who announced a reduction in the timing of the withdrawal of incentives, which bitcoin investors perceived negatively.
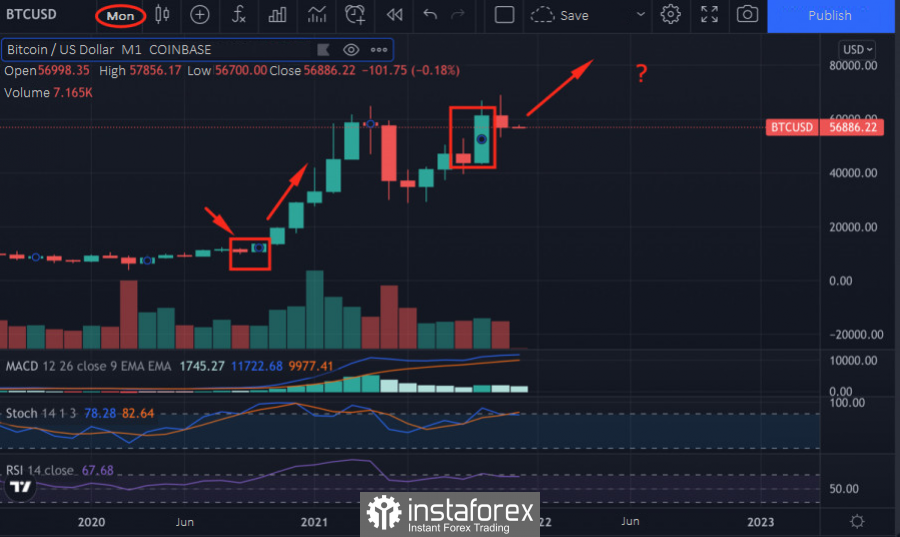
In general, the situation remained uncertain throughout the month, and a slight downward price deviation was predictable given the ATH update (one PlanB expert removes a meager analytical tear). Perhaps December will be a bullish ending to a difficult, but in general, fateful year for Bitcoin. My first argument is a similar situation in September-October 2020. Then, on the monthly timeframe of Bitcoin, a "bullish engulfing" pattern was formed, after which the price began a powerful bullish ascent, repeatedly updating the historical record. We see that in 2021, the engulfing pattern also formed in September-October. And given the cyclical nature of the BTC market, it can be assumed that the situation will be similar this year.

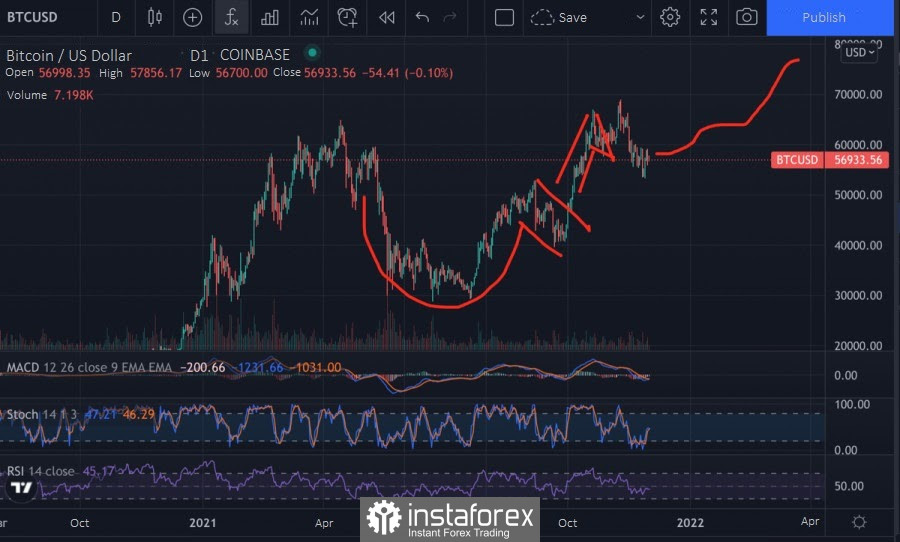
On the daily timeframe, a global bullish pattern has formed, with a potential around $75k. The chart shows the figure of the "cup and handle" technical analysis, the potential of which predicts bitcoin to update ATH above $70k. Following this pattern, a "bullish pennant" has formed, the potential of which also points to the $70k- $75k zone. These are two global bullish signs, confirming the assumptions about the approaching main stage of the bull market.

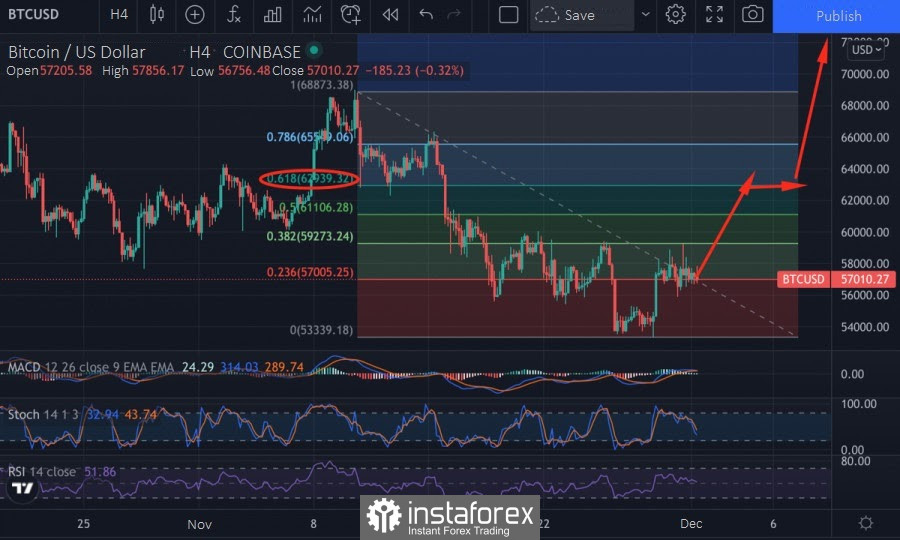
Probably, only part of December will fall into the stage of a strong bullish rally, as the head of the Fed and the uncertainty of some institutional audience stretched the BTC recovery period, and therefore I will wait for impulse attempts to break through the key barrier around $62.5k, where the 0.618 Fibo level passes. A confident bullish breakdown of this area and consolidation over it may be the main signal to the market's readiness to update the price maximums.

