EUR/USD
Analysis:
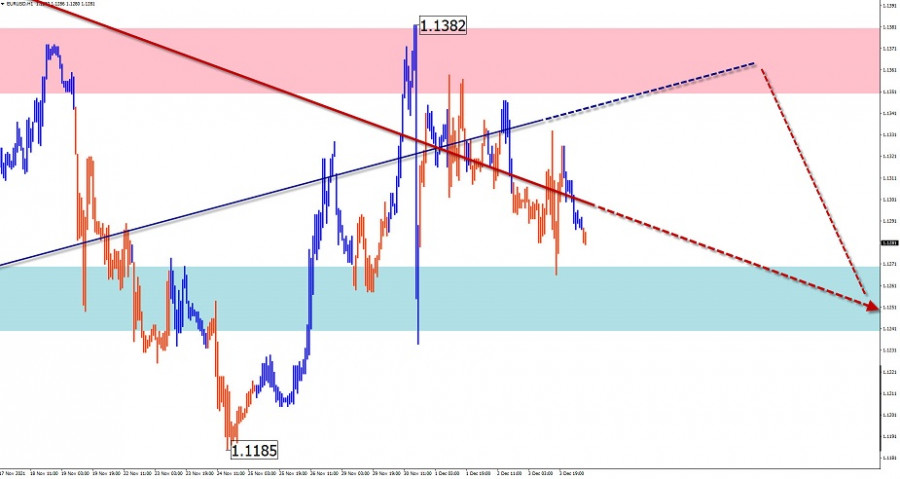
The dominant bearish wave on the euro chart has led the major to a cluster of support levels of different sizes. The upward wave that started in the middle of last month has no reversal potential and does not go beyond correction. Its structure is incomplete at the time of analysis.
Outlook:
In the next day, the price is expected to move in the corridor between the nearest counter zones. After the pressure on the support zone, the change of vector and growth of quotations to the area of calculated resistance is possible.
Potential reversal zones
Resistance:
- 1.1350/1.1380
Support:
- 1.1270/1.1240
Recommendations:
Today, trading in the major euro pair market is possible only within individual sessions. Small lot purchases are safer.

USD/JPY
Analysis:
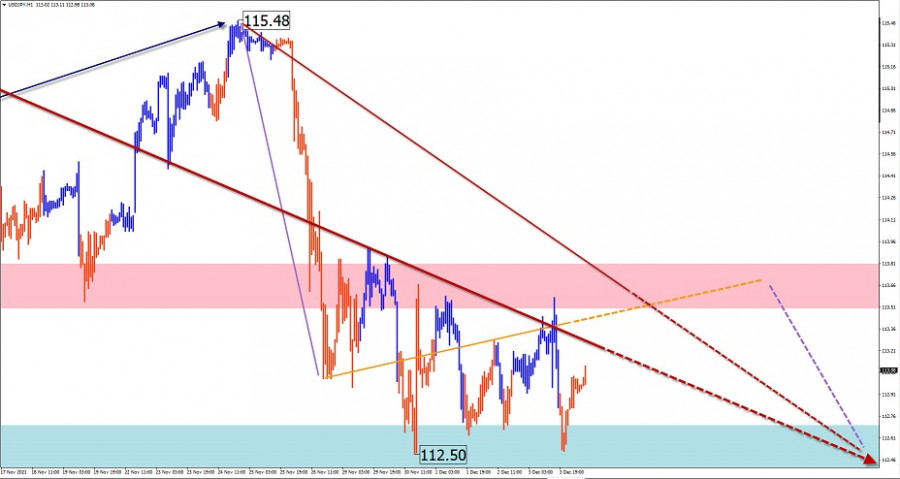
The uptrend in the major Japanese yen pair has pushed quotations into a potential weekly reversal zone. A downward stretching plane has been taking shape on the chart since mid-October. The structure of this wave seems complete. Signals of an imminent reversal have not yet been observed on the chart.
Outlook:
The most probable scenario of the yen movement today is a movement in a sideways corridor between the opposing zones. An upward vector is expected in the European session.
Potential reversal zones
Resistance:
- 113.50/113.80
Support:
- 112.70/112.40
Recommendations:
Trading in the pair's market today may be safe only within individual sessions with fractional lots. Selling will become possible after the appearance of clear signals of a reversal around the resistance zone.

GBP/JPY
Analysis:
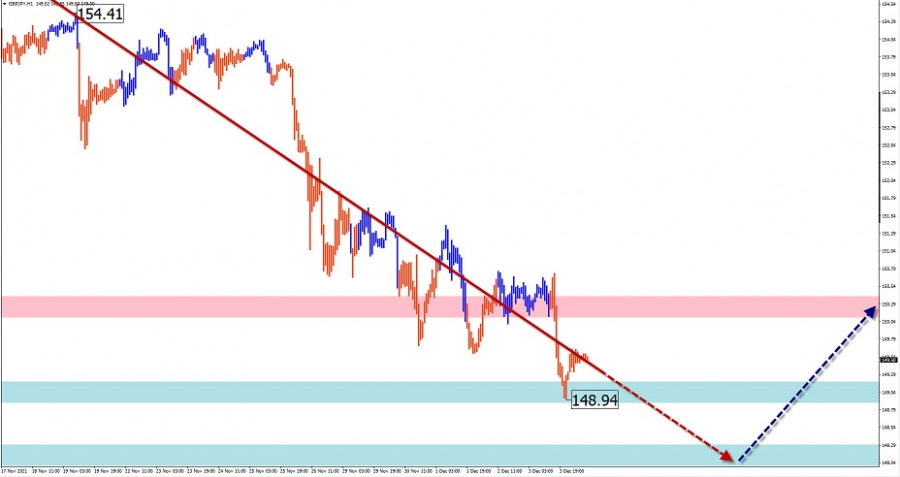
The decline of the GBP/JPY cross that started a month and a half ago has pushed the quotations to the area of strong support of the large timeframe. Below the current figures, there is a cluster of several support levels, one of which may complete the current wave.
Outlook:
A continuation of the general downtrend is likely in the coming day. At the European session, short-term price rise is not excluded, not further than the calculated resistance. Active declines are more likely at the end of the day or tomorrow.
Potential reversal zones
Resistance:
- 150.10/150.40
Support:
- 149.20/148.90
- 148.30/148.00
Recommendations:
Buying in the cross-market is not recommended until there is a clear reversal signal. Calculated resistance shows the optimal level to search for sell signals. It is worth taking into account the limited potential of the forthcoming decline.

GOLD
Analysis:
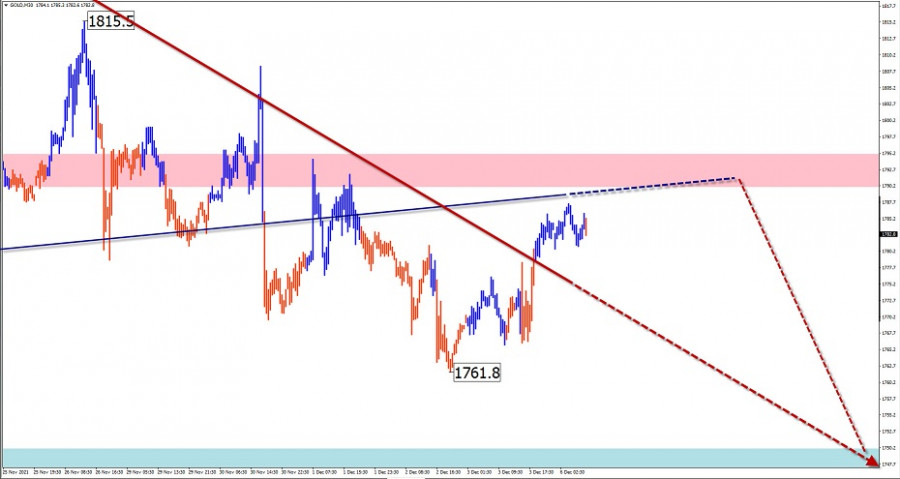
The upward wave in the gold market that started in February is the closest to a shifting plane in terms of structure. The correction section from November 10 has started its final phase. In the last two weeks, an intermediate pullback has been formed in the horizontal plane.
Outlook:
Completion of the price pullback is expected in the coming trading sessions. Further, we can expect the formation of a reversal and resumption of the bearish trend.
Potential reversal zones
Resistance:
- 1790.0/1795.0
Support:
- 1750.0/1745.0
Recommendations:
Until the completion of the current price rally, it is advisable to refrain from trading in gold. After the clear signals of reversal near the resistance area, it is recommended to sell.

Explanation: In simplified wave analysis (SVA), waves consist of 3 parts (A-B-C). The last unfinished wave is analyzed. The solid arrow background shows the structure formed. The dotted arrow shows the expected movements.
Attention: The wave algorithm does not take into account the duration of the instrument movements over time!
The material has been provided by InstaForex Company - www.instaforex.com